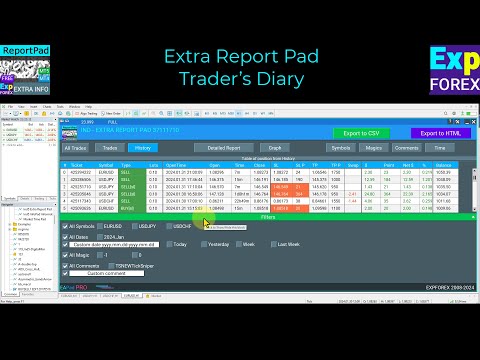
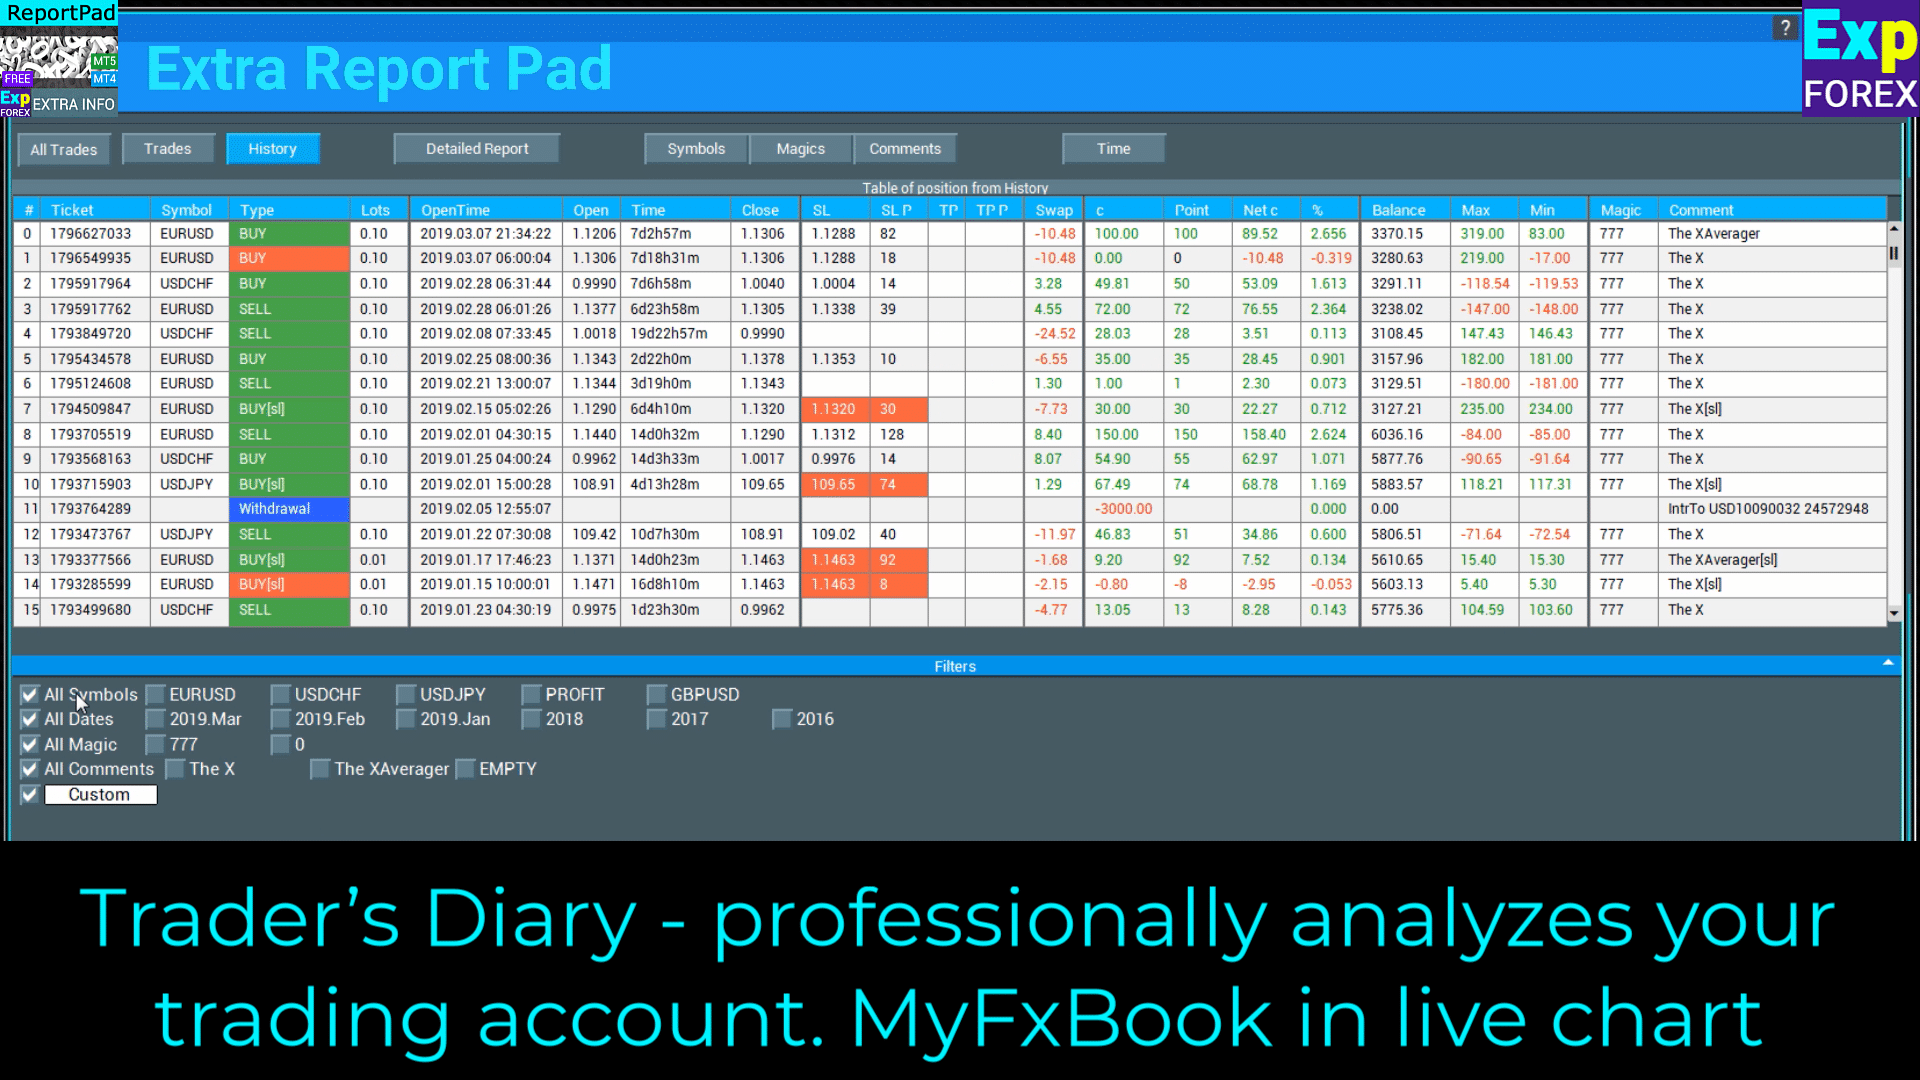
Extra Report Pad Traders’ Diary. This is a statistics panel providing an analysis of your trading account for MetaTrader.
The analysis results are displayed on the chart in real-time. Multicurrency trading is very popular. However, the greater the number of trades, the more difficult it is to analyze each trade’s profitability. Professional analysis of trades by month and calculating statistics per trade are even more challenging tasks. The Extra Report Pad panel provides an efficient solution for analyzing your account and preparing detailed statistics in real-time in HTML, CSV, or Chart. Like MyFxBook If you’re looking to get a comprehensive understanding of your trading system’s performance, there are multiple tools available that can help you achieve this goal. Extra Report Pad includes Reports, Statistics, myfxbook, Trading journals, account analysis, performance statistics, analytics, and an innovative dashboard. By utilizing Extra Report Pad, you can analyze your trading system’s performance in great detail and obtain valuable insights into areas of strength and potential weaknesses.
Whether you’re a new trader looking to improve your performance or an experienced trader seeking to optimize your trading strategy, these Extra Report Pad can provide you with the information you need to make informed decisions and achieve your financial goals.
How does Extra Report Pad work?
Extra Report Pad Trader’s Diary – professionally analyzes your trading account. MyFxBook in live chart
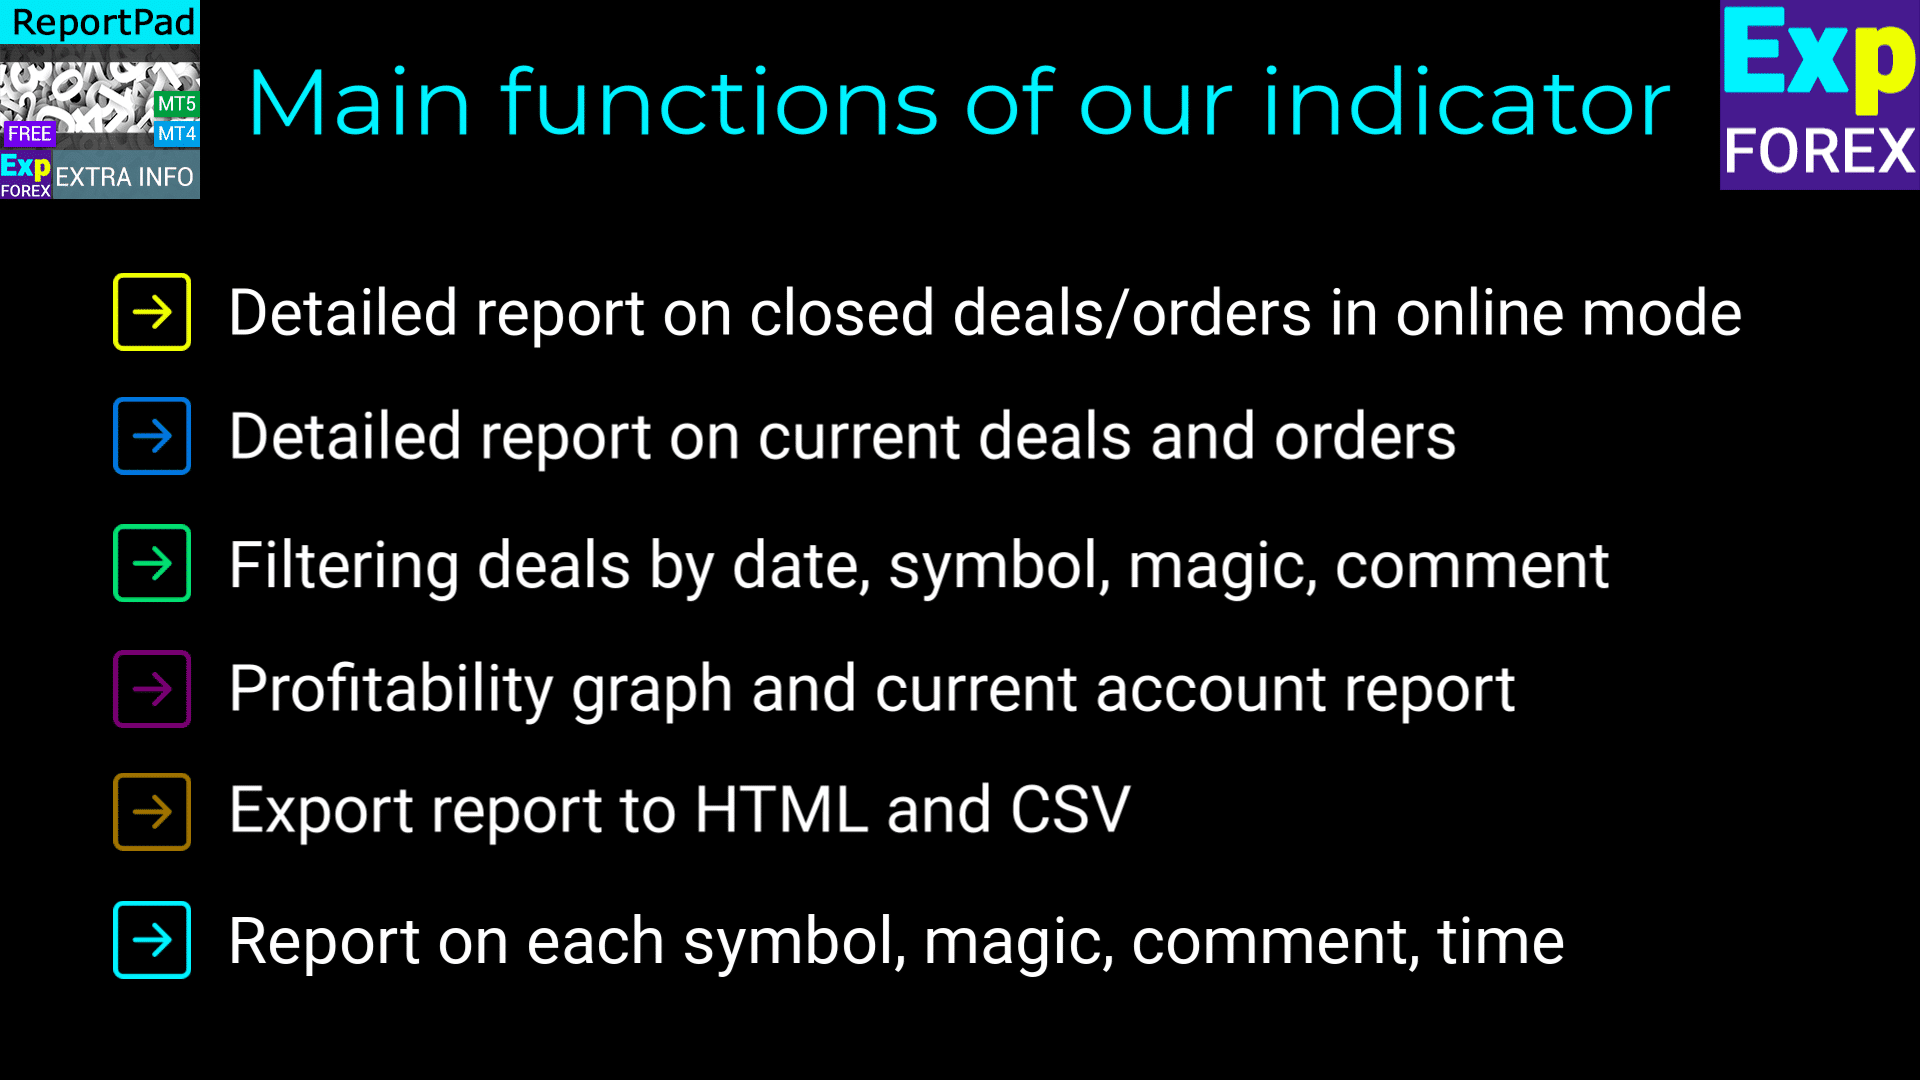
Main functions of Extra Report Pad
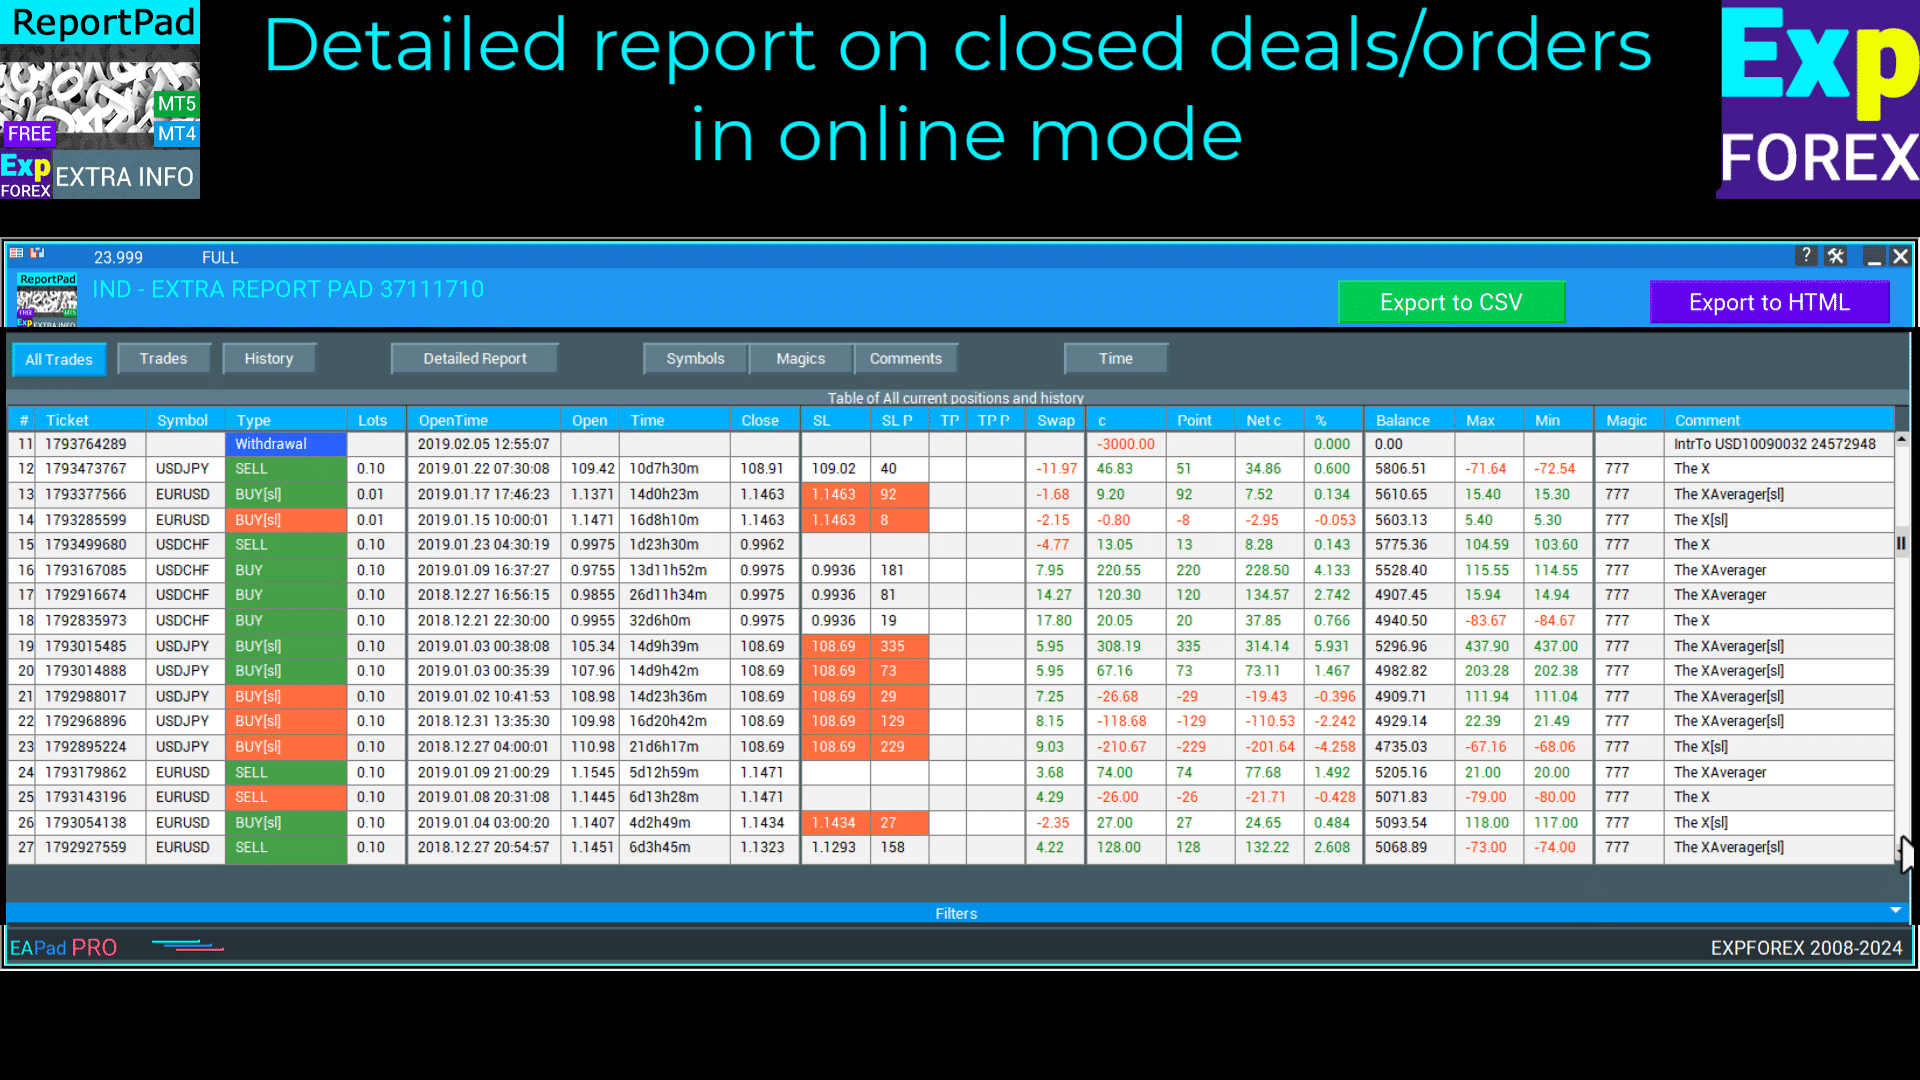
Extra Report Pad Detailed report on closed deals/orders in online mode
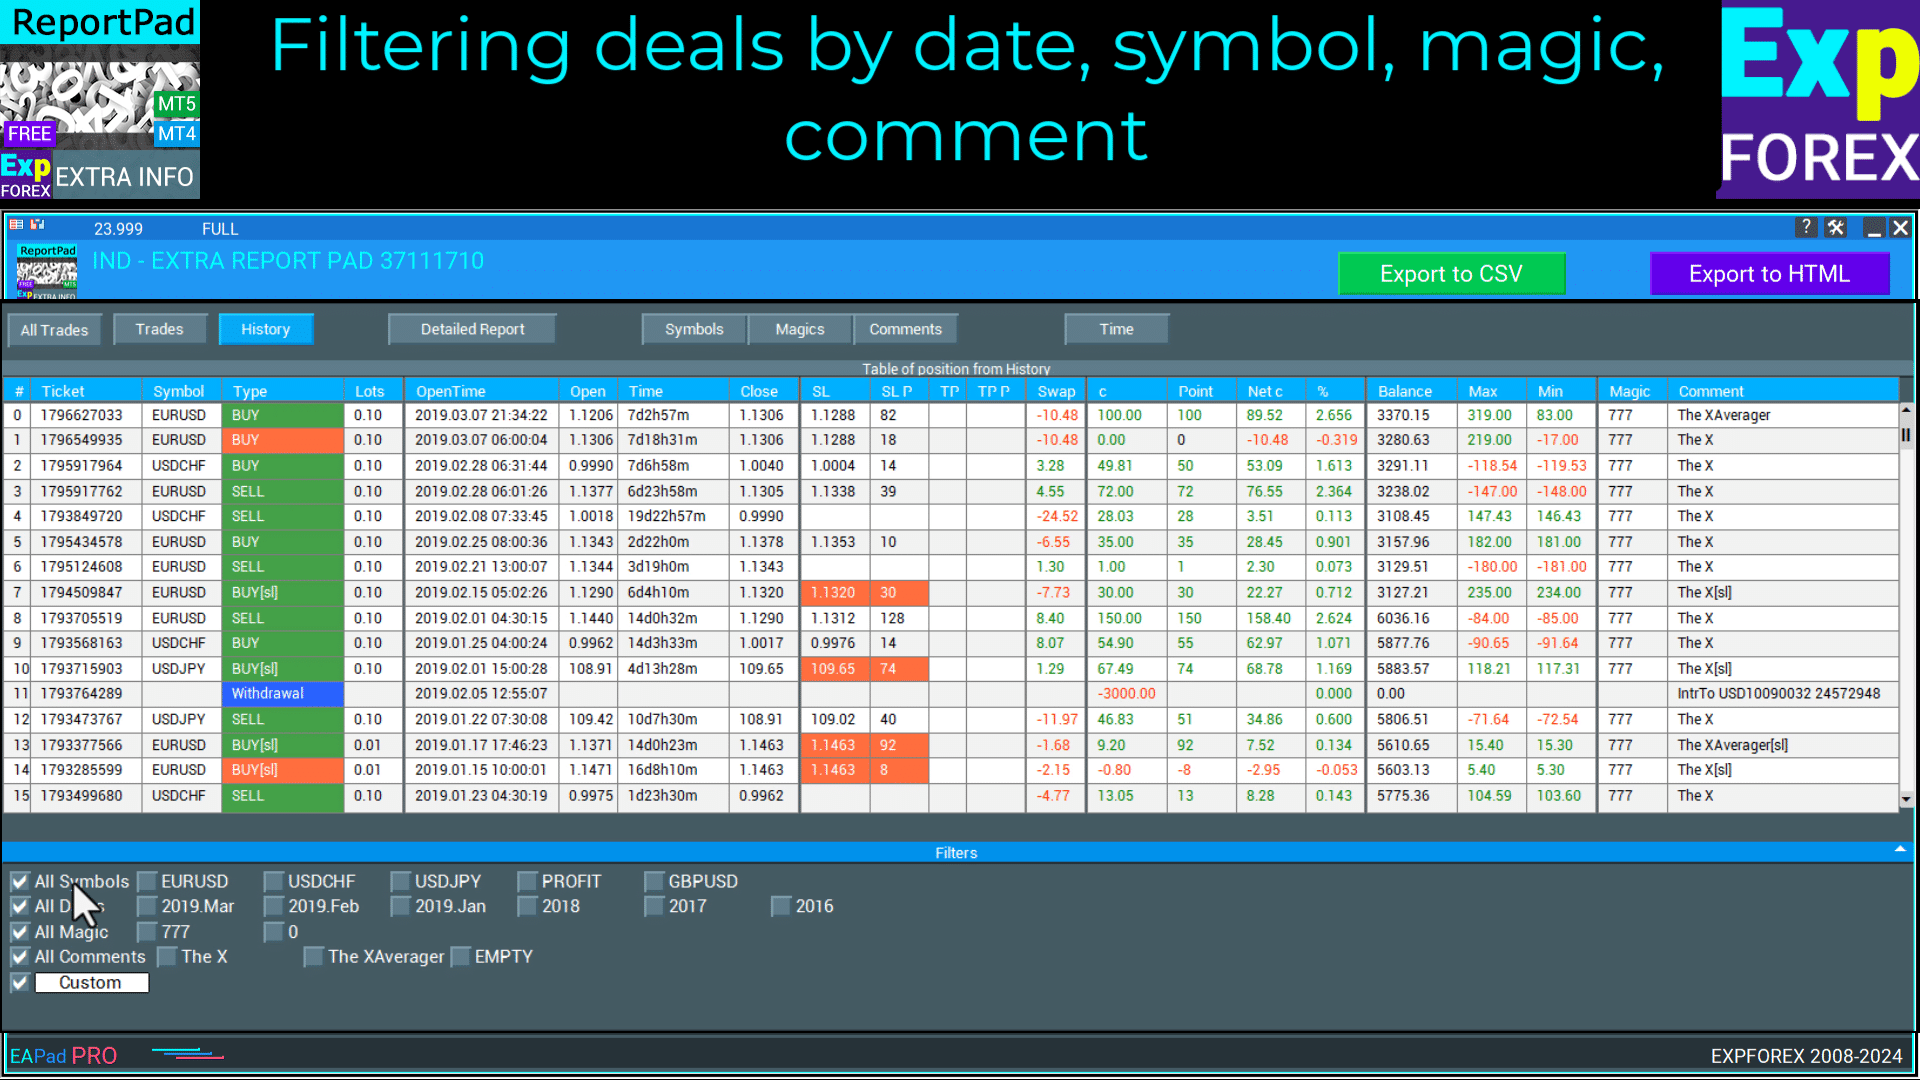
Extra Report Pad Filtering deals by date, symbol, magic, comment
Extra Report Pad Profitability graph and current account report
Fabrizio Malavasi
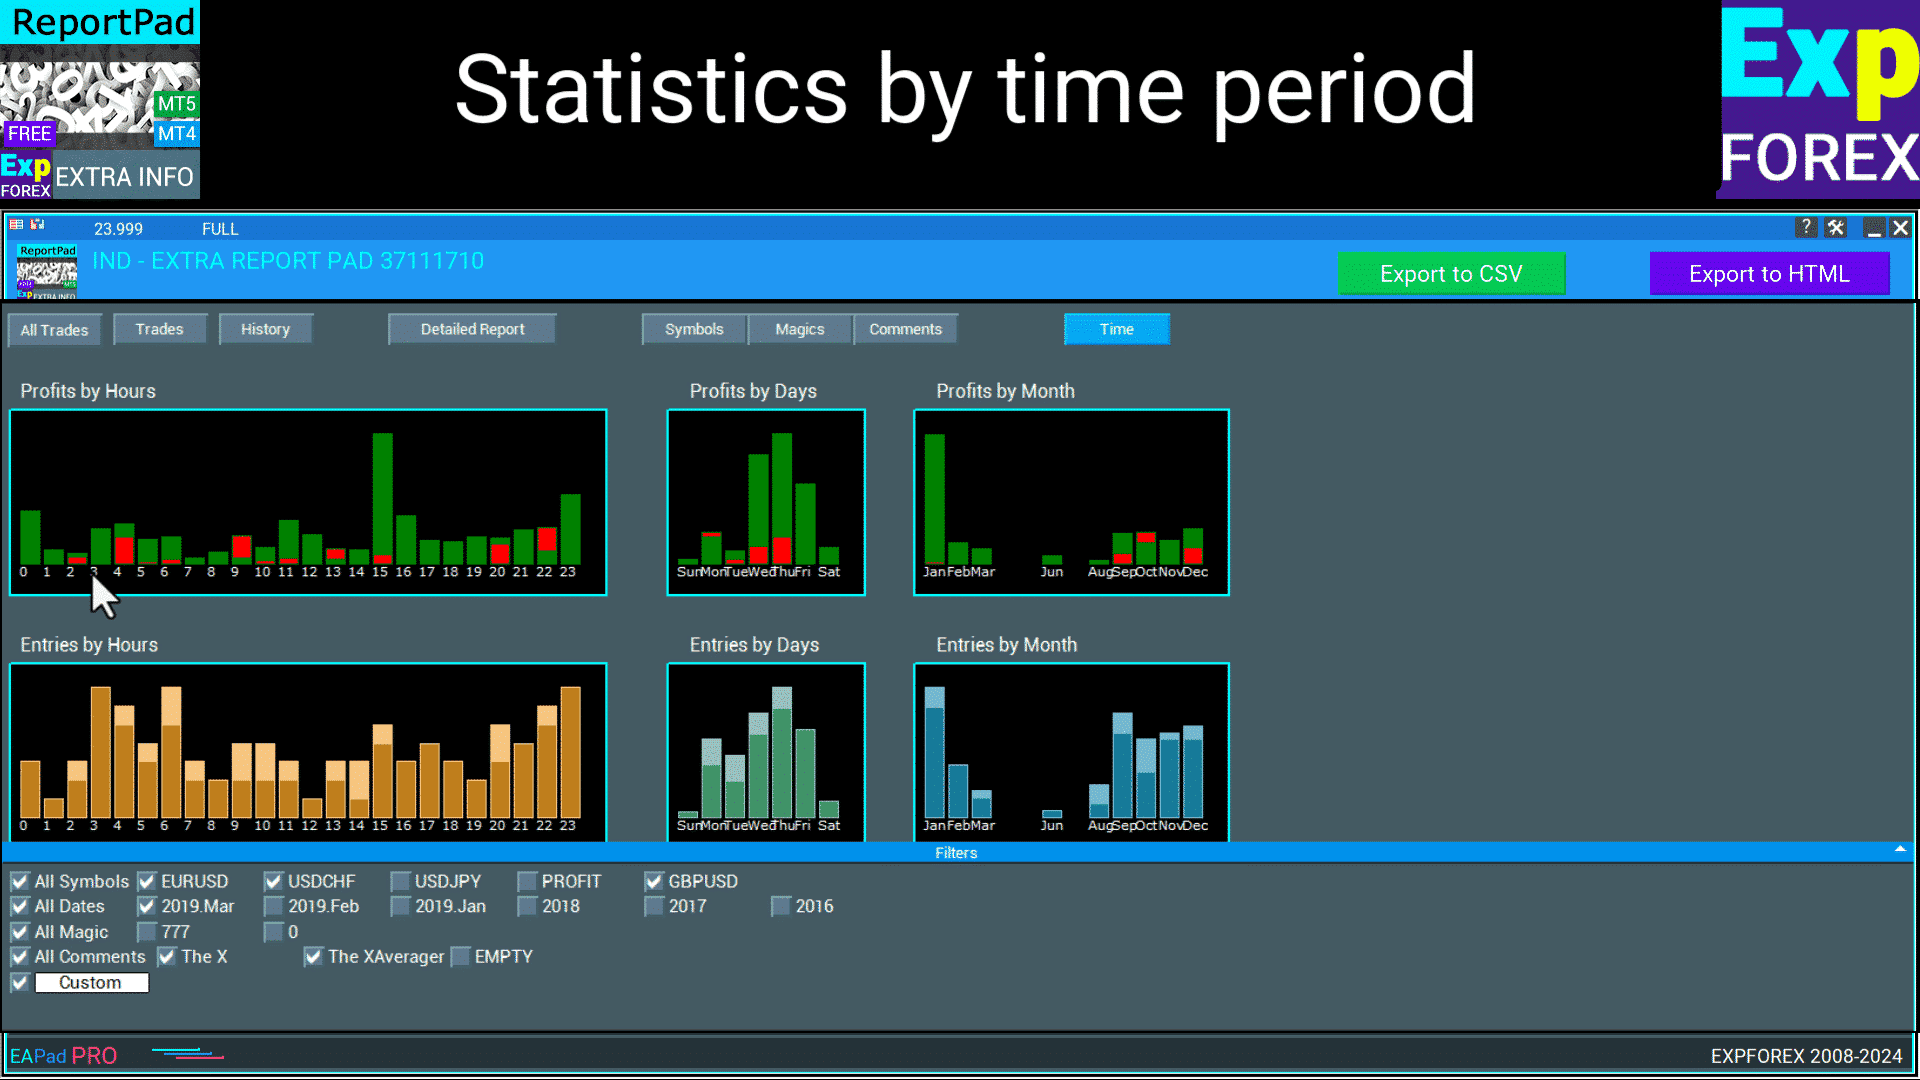
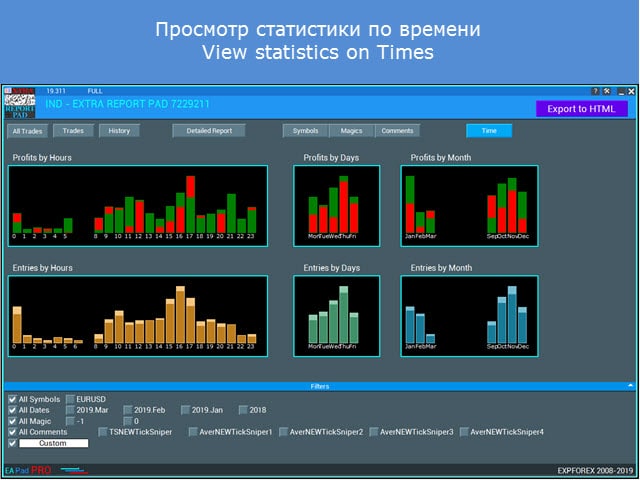
This reporting app it's a very useful tool to analyse the trades order history.The "Time" button that show the profit/entry along the time It's interesting too. It has a very nice graphic form. You made as usual an excellent job!
Thanks a lots!
Jcb Mlwijk
Excellent reporting functionality that provides you with detailed insights into their trading performance. The tool generates trade history reports, including key metrics such as profit/loss analysis, drawdown, and risk exposure.
This indicator is amazing. It also has the max upside watermark and the lowest drawdown that was in profit per trade. Compare it to the actual profit or loss, then use an EA like Account Protector and tell it to take profit or stop loss at the average high watermark and stop loss at at the lowest above the largest drawdowns. It will increase your profits and mimimize your losses. just review your trades daily or weekly and you will find this tool invaluable. And the reports are far better than Metatraders. And it gives you a report analysis of all your trades with win and lose rate, profit ration, lowest overall drawdown, etc. You can also filter your trades by comment or magic number to get a drilled down deeper insight. Great job author!
Yong Chan Kow
Very useful. It can generate reports that include magic numbers, comments and other fields. This enabled me to analyse performance from various angles.
Hristo
Fantastic tool, much better than anything I have seen on the market. I am not sure how the filtering at the bottom is working, for example when clicking on just one Magic number it does say Updating at the top, but the table remains the same with the previous information on it, also if there could be an option to Sort from A-Z / Bigger-Smaller...etc on the actual panel that would be amazing. Also not sure if it has already this function but to be able to display the number of pips/points per magic number or comment would be great because this way easily EA's can be compared between two different platforms with different balance lot sizes. Anyway, it is the best tool I have seen so far. Well done to the developer. Great job.
cbarryftmo
At last, I've discovered exactly what I needed! I'd been searching for a tool to assess the performance of various EAs over time, but couldn't find one. The program I downloaded earlier lacked the feature to label prices traded by specific EAs. This tool fulfills my requirement perfectly. I'm extremely grateful for the expertise behind its development and the superior ability to download information. Thank you so much!
hwschmidt
Tolles Tool. Sehr viele Informationen die man bisher nicht hatte. Für mich besonders gut weil ich die Daten jetzt besser nach Excel übertragen kann ohne das die Formatierung leidet. Danke
Yusuf Mansawala
It's a useful tool for Fund Mangers and Clients trading with multiple signals or multiple copy trading services, as it can sort out your account statement into a powerful decision making tool.
Ron Inchess
Really useful product, just what I was looking for. The author's site is also interesting. Worth a visit. Some difficulty in configuring the MT5 dimensions. The reports to download are excellent and clear. Very useful for work evaluations.
-
Prodotto veramente utile, proprio quello che cercavo. Anche il sito dell'autore è interessante. Da visitare. Qualche difficoltà a configurare le dimensioni di MT5.I reports da scaricare sono ottimi e chiari. Molto utili per le valutazioni di lavoro.
Extra Report Pad is a professional solution for analyzing your trading account effectively.
Trader’s Diary professionally analyzes your trading account, similar to MyFxBook with live charts.
Today, it’s essential to trade multiple currency pairs simultaneously.
Extra Report Pad is a professional tool for analyzing your trading account. Trader’s Diary professionally analyzes your trading account on live charts, much like MyFxBook.
However, the more trades you make, the more challenging it becomes to professionally analyze the profitability of your account.
Analyzing trades by month becomes even more difficult.
Furthermore, calculating statistical data for each trade individually is even more challenging.
We found a solution: Our panel can professionally analyze your account and compile statistics in as much detail as possible in real-time.
An indicator for collecting and analyzing your trading account.
Foreword
Since the beginning of our work in Forex, much time has passed, and trading on the Forex market has made us distracted by tasks such as trading account analysis. This is especially true for experts who rely on automated systems.
Analyzing profitable trading pairs based on the standard MetaTrader report is very difficult. It does not contain detailed data on trades, let alone data on profitable currency pairs and monthly statistics.
You can monitor your account using one of the services to collect statistics, but it’s not entirely convenient.
After testing over a monthly period, we had to manually dissect the report to determine which pairs were profitable and which were not—and based on the data, to further refine the system.
We found a solution to this problem and created the EXTRA REPORT PAD indicator, capable of automatically professionally analyzing your account and displaying detailed information in real-time!
Benefits
Our indicator is designed to analyze Forex trading in real-time. Utilize comprehensive statistics and all data that can be extracted from the MetaTrader terminal!
MyFxBook Mini is integrated into your terminal window and is always at your fingertips!
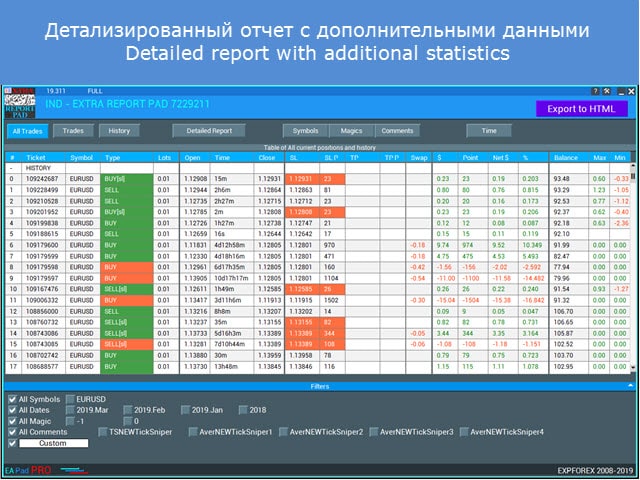
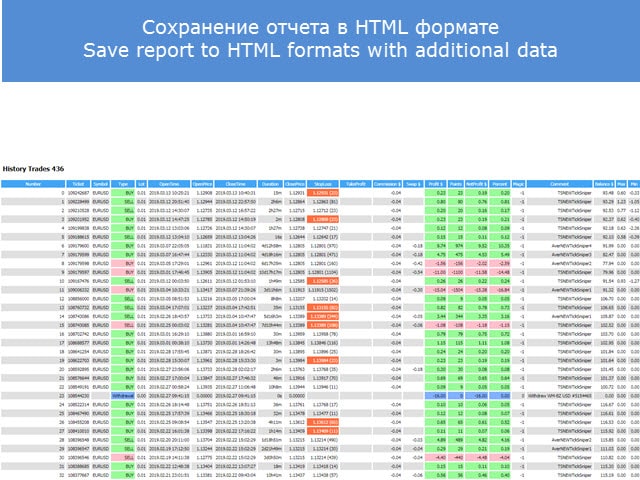
A detailed report uploaded in HTML contains 500% more information than the standard MT report.
Old MetaTrader Detailed Report
New Detailed Report Created by Extra Report Pad
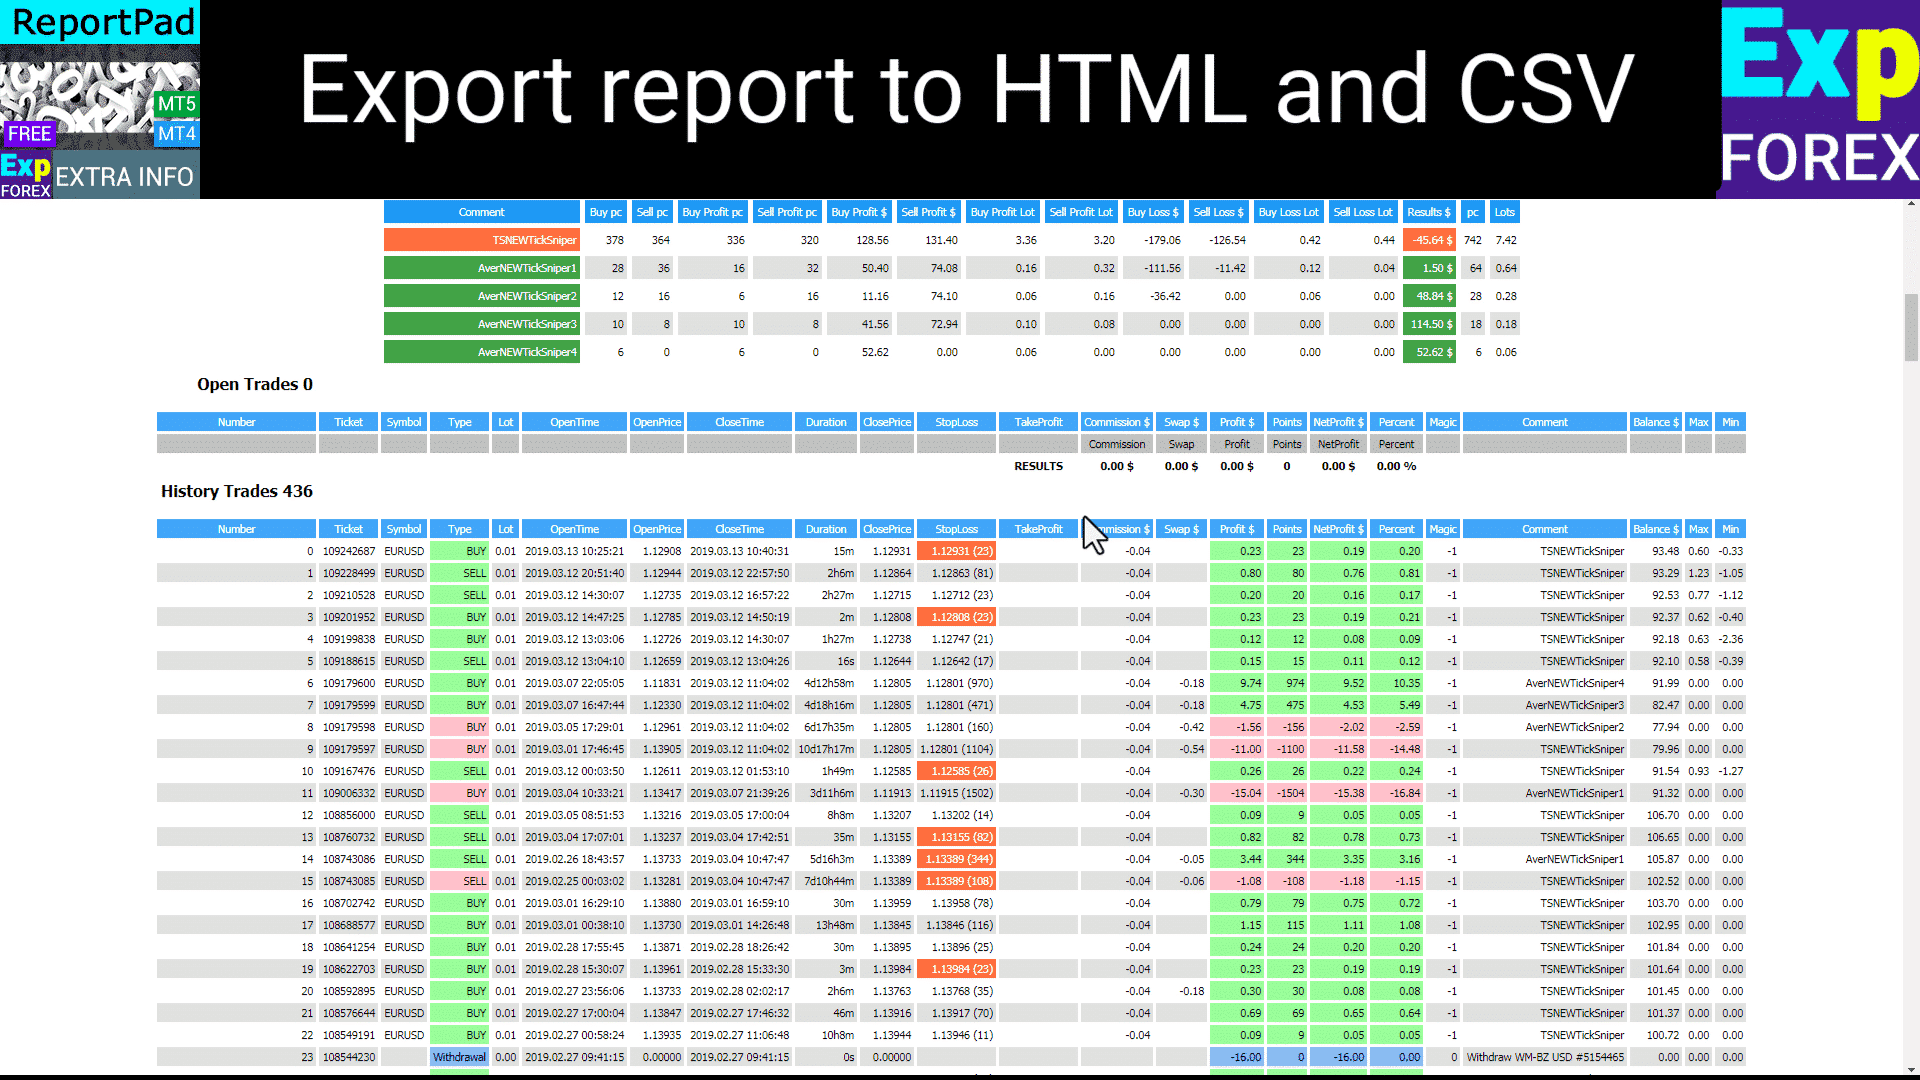
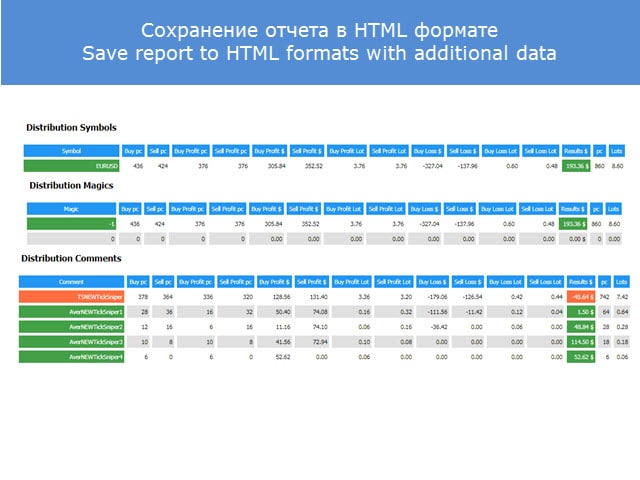
Export to HTML and CSV
We added the EXPORT to HTML button to Extra Report Pad, which exports the entire report from the chart into a separate HTML file. All trades are filtered according to the filters used in the panel. For example, you can select only one currency pair, a specific magic number, or a specific month. The generated report will contain only the filtered data.
To open your HTML Detailed Report:
Open the Data folder.
The report file is created in the folder: YOUR TERMINAL \ MQL4 \ Files \ EXTRAREPORTPAD \ EXTRAREPORTPAD AccountNumber.html
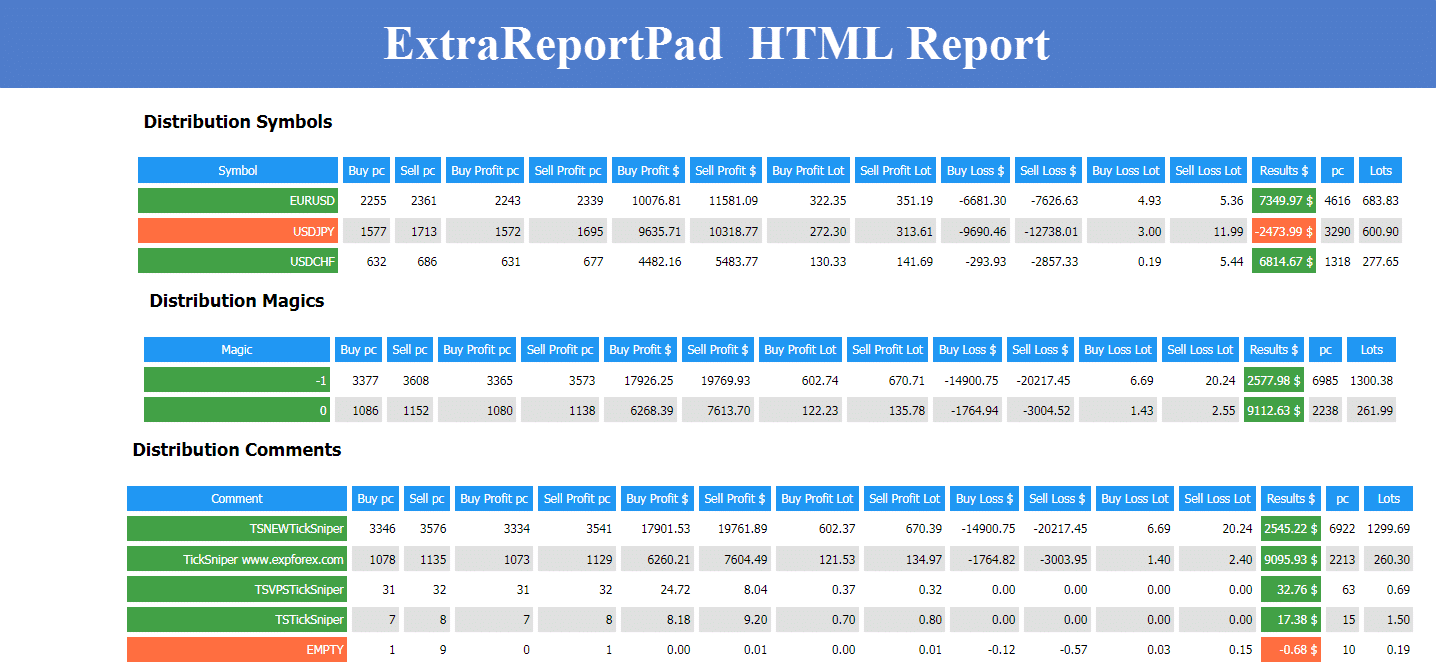
Example of HTML:
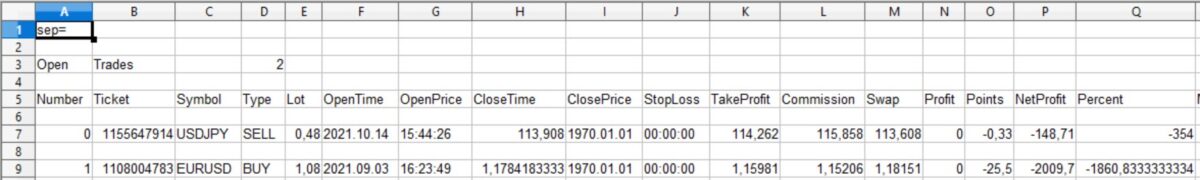
Example of CSV:
Tabs and Controls
Our panel currently consists of 9 tabs:
TRADES – Displays current open trades.
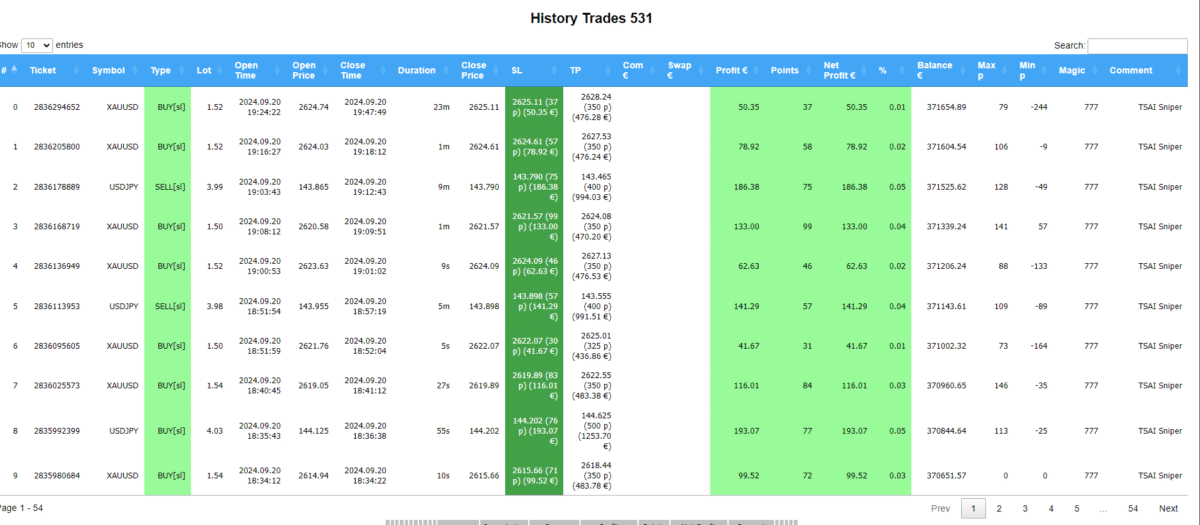
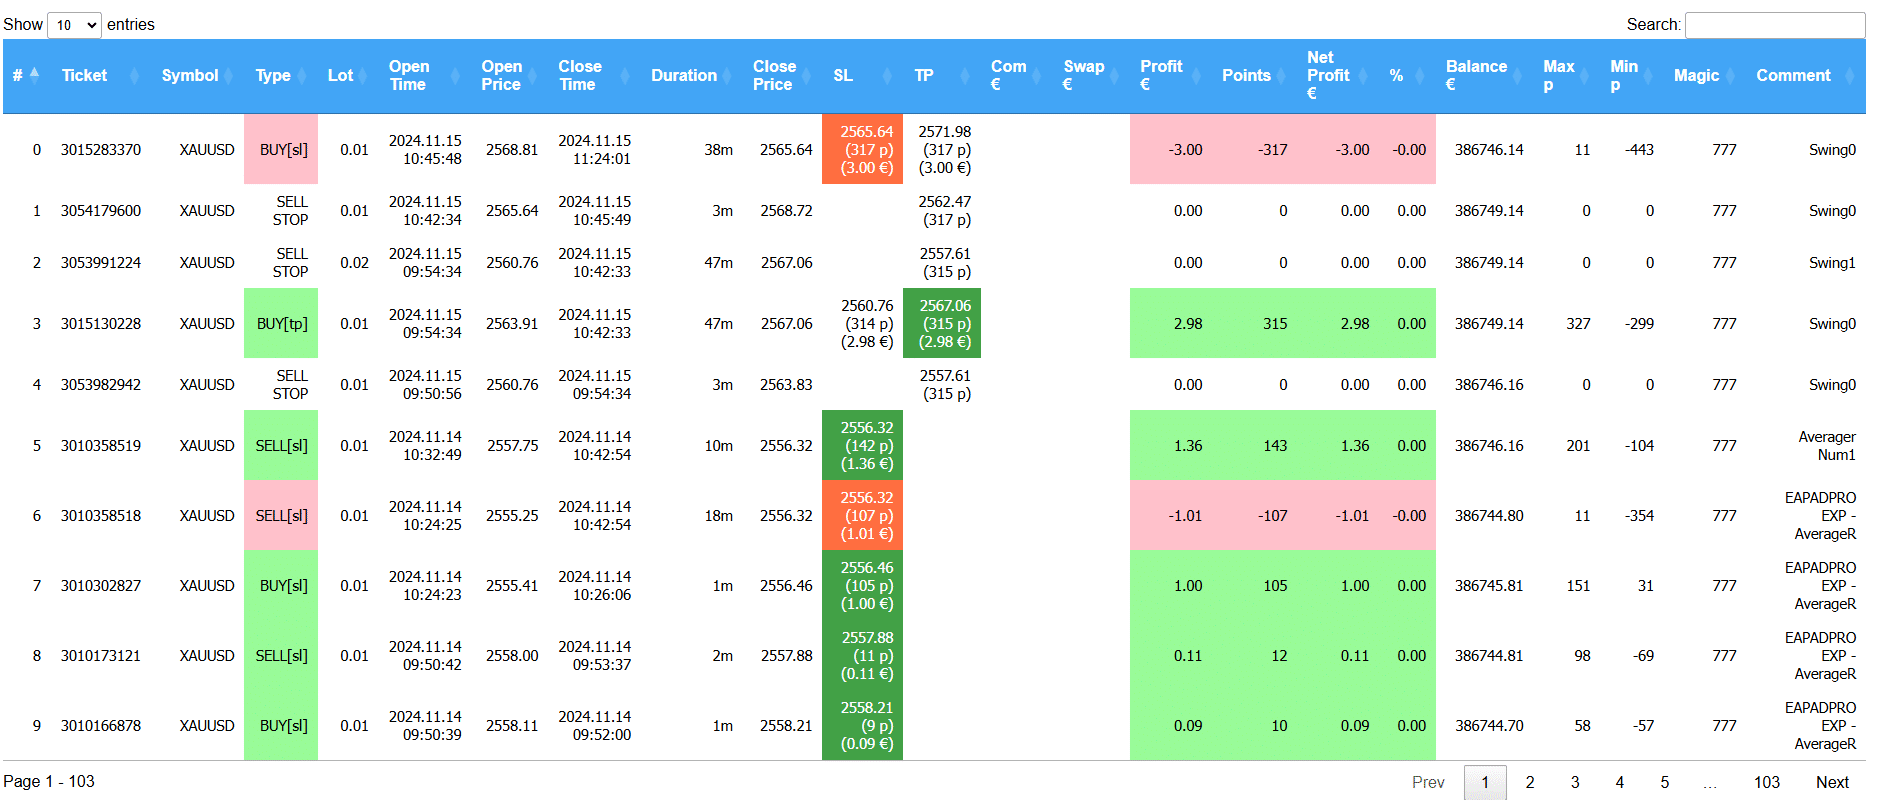
HISTORY – Displays closed trades from history.
ALL TRADES – Displays both open and closed trades.
REPORTS – Shows a detailed report on the closed trades of your trading account.
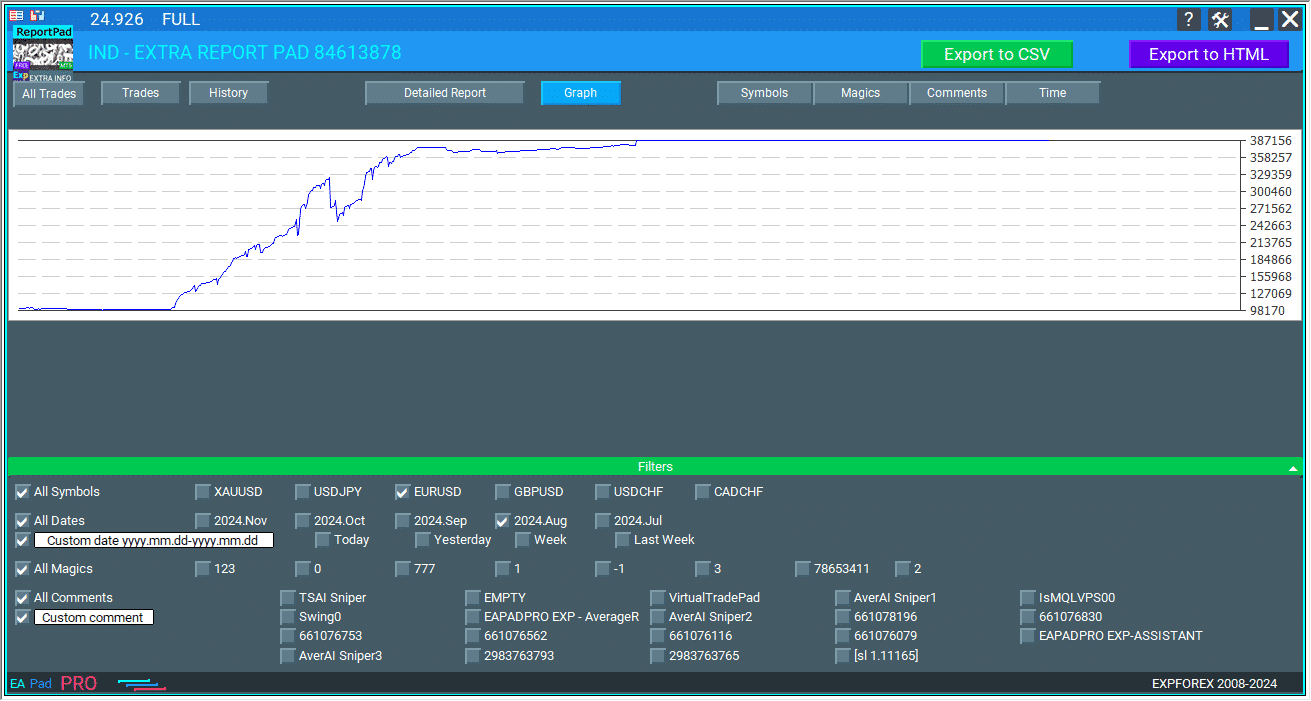
GRAPH PROFIT CHART – Provides a visual representation of the profit trends over time, allowing you to assess the overall profitability of your trades and see patterns or fluctuations in your trading performance.
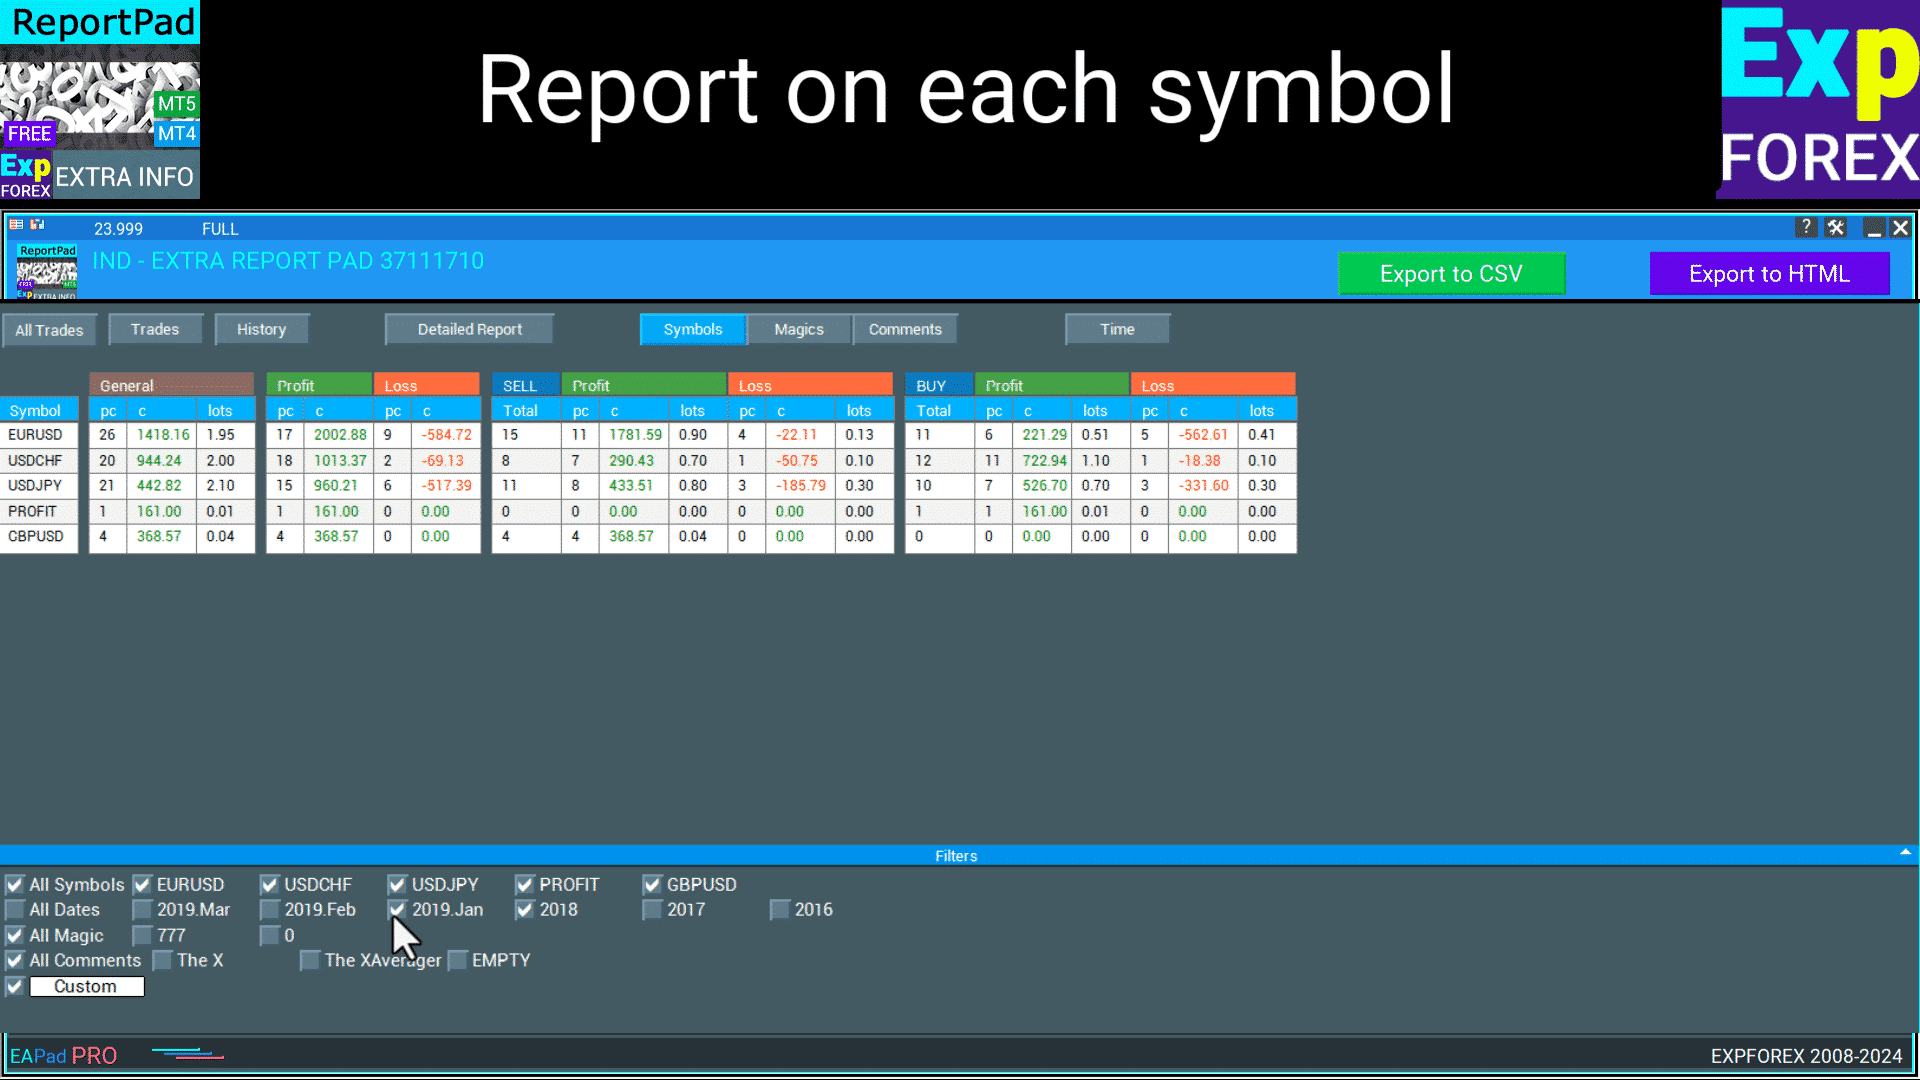
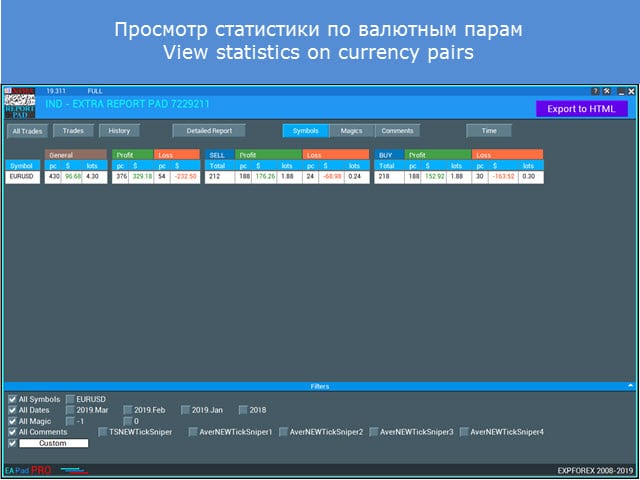
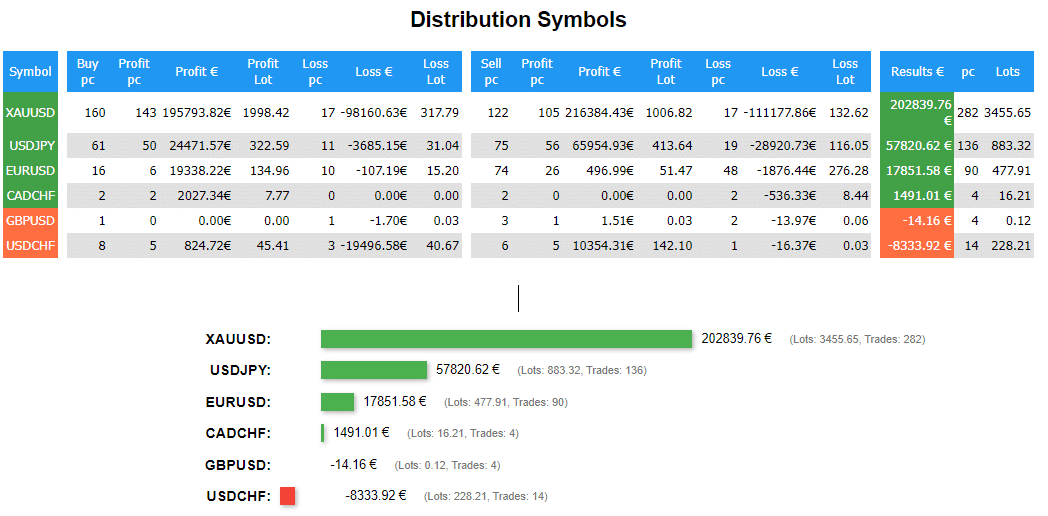
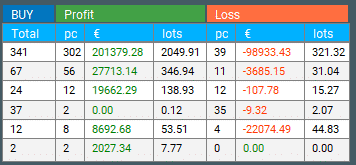
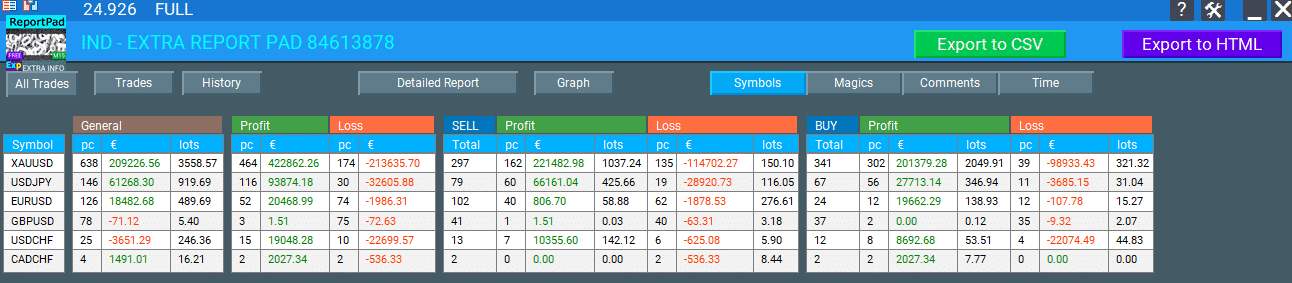
DISTRIBUTION Symbols – Shows the distribution of BUY and SELL trades with the total number, as well as the number of profitable trades for each currency pair separately. It also displays the distribution of profitable trades, their total profit, and lot size for each currency pair individually, as well as the distribution of losing trades for each symbol.
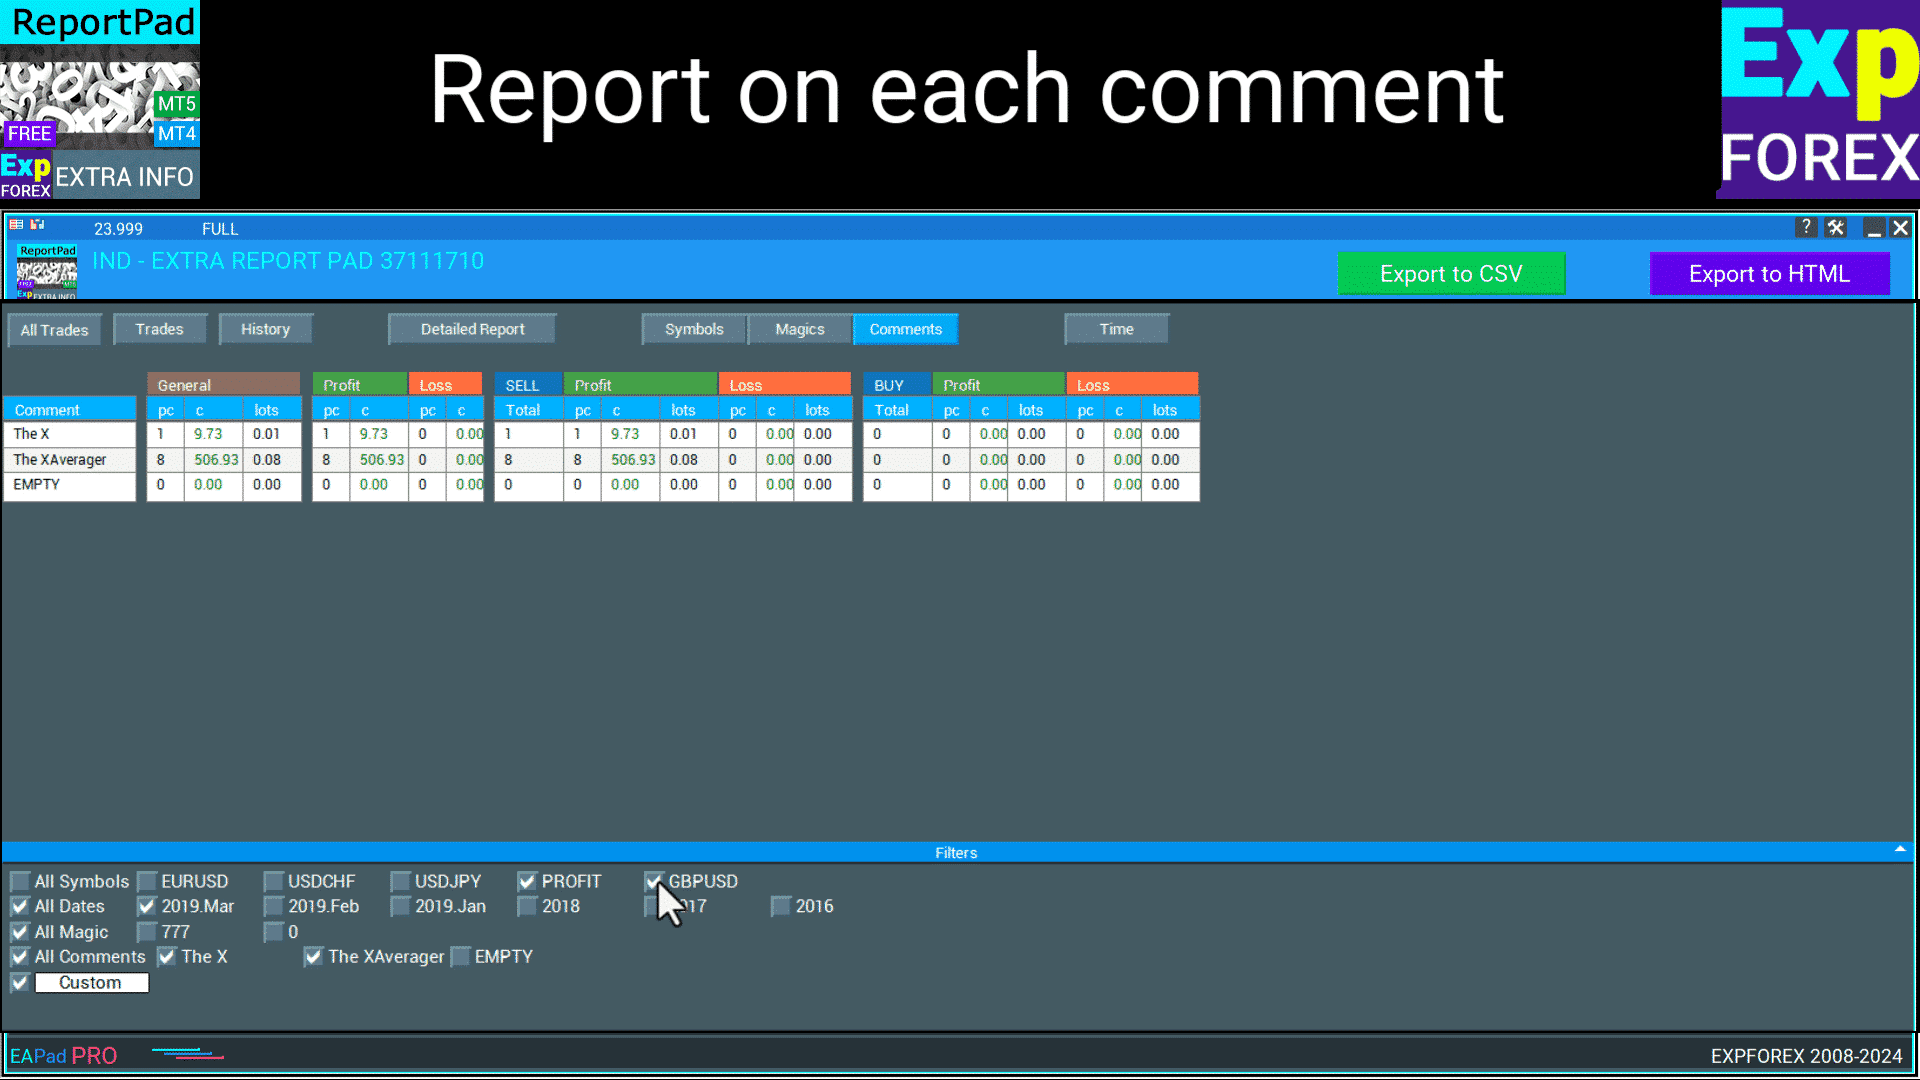
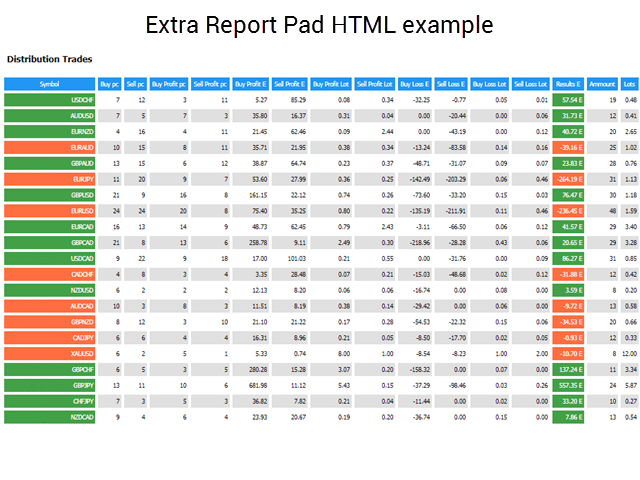
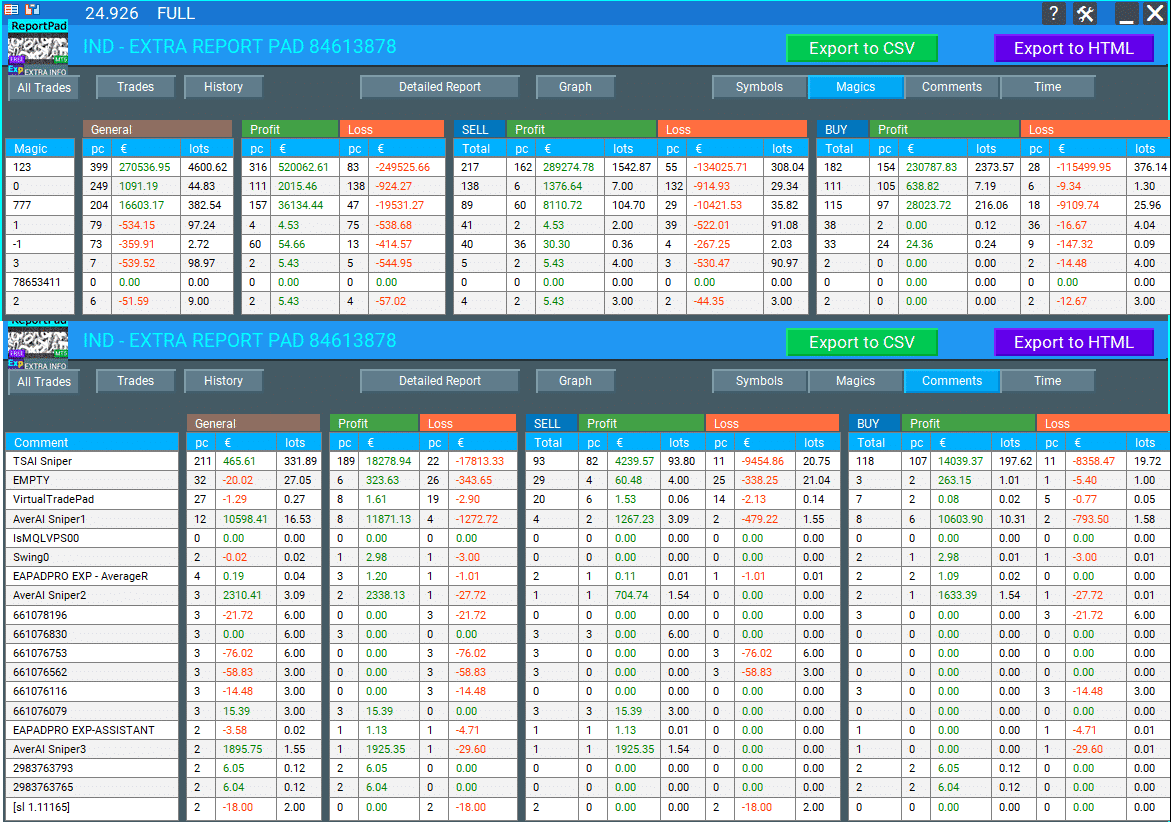
DISTRIBUTION by Comments – Shows the distribution of trades categorized by specific comments, including the total number of BUY and SELL trades, profitable trades, their total profit, and lot size based on each unique comment. It also shows the distribution of losing trades for each comment category.
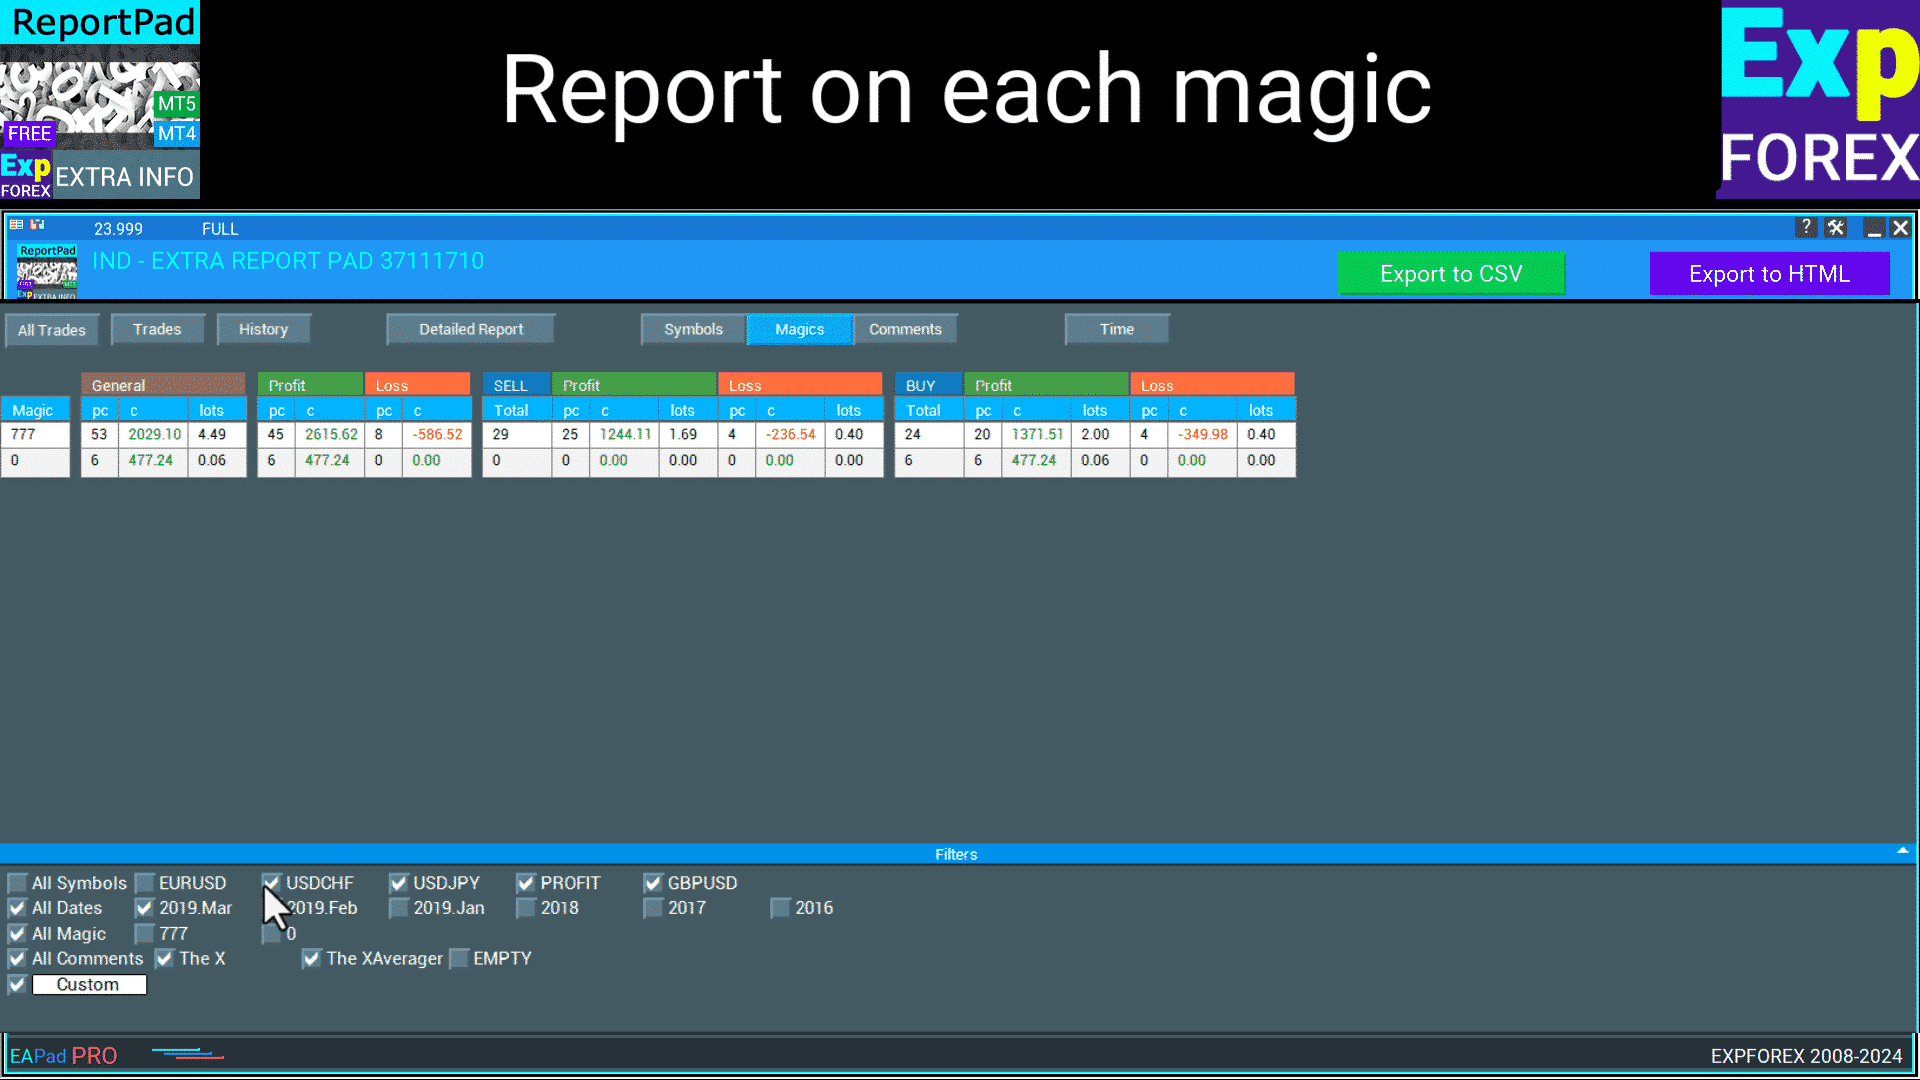
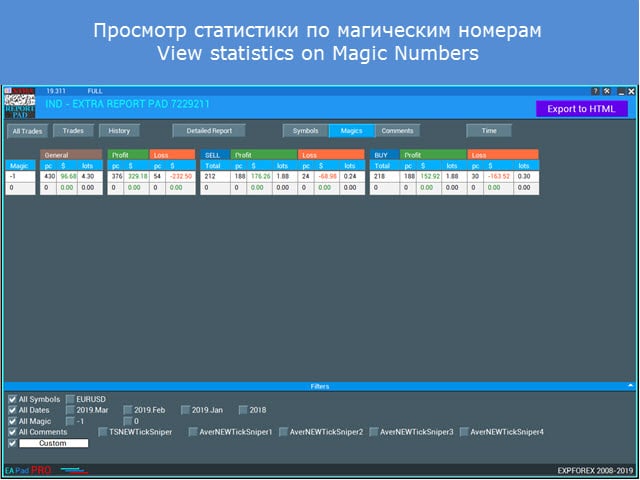
DISTRIBUTION by Magic Numbers – Shows the distribution of trades categorized by magic numbers, detailing the total number of BUY and SELL trades, profitable trades, their total profit, and lot size for each magic number individually. It also displays the distribution of losing trades for each magic number.
DISTRIBUTION Time – Displays the number of trades, as well as profit or loss by hours, days of the week, and months. By looking at the column names, you can get data for each category.
Our panel is built on an improved template from the trading panels VIRTUALTRADEPAD and EAPADPRO, so some elements are repeated.
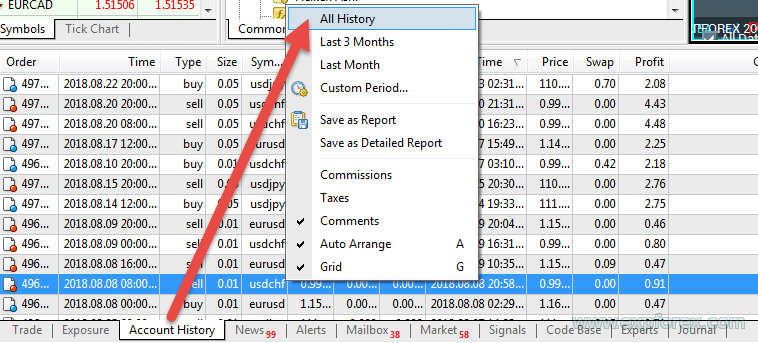
Attention! To display all positions from the account history, you need to select the entire account history tab in Account History.
Go to the Account History tab and right-click – selectAll History.
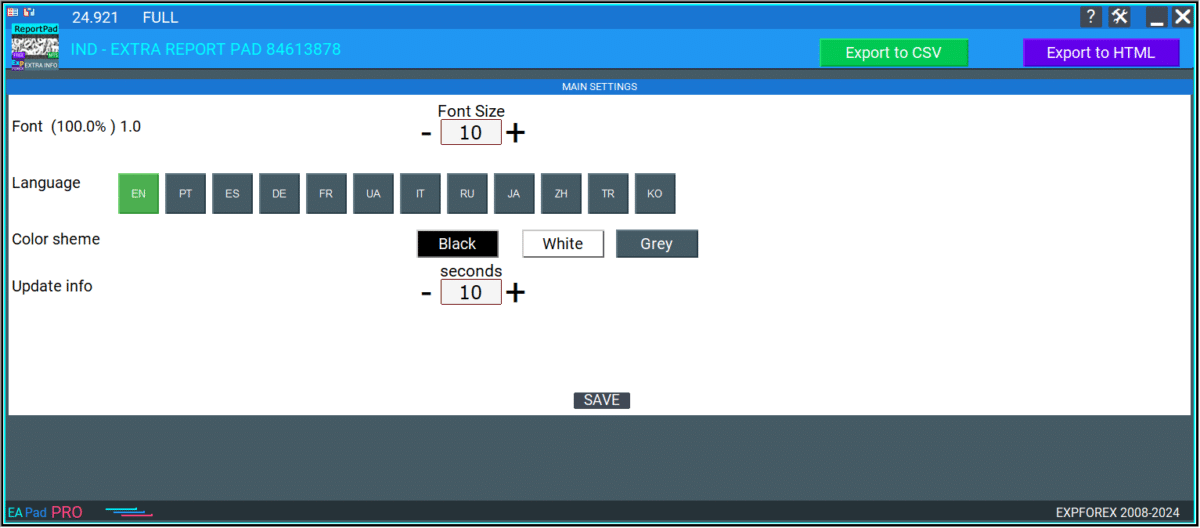
Font Size, Minimize, and Close the Panel. Settings
You can change the font size for the panel directly on the panel itself, as well as collapse and close the panel.
Available languages: English, Ukrainian, Portuguese, Spanish, Italian, French, German, Chinese, Japanese, Korean, and Turkish.
Filters
Filter by Symbol;
Filter by Date;
Filter by Magic;
Filter by Comment.
On each tab, you can filter statistics by availability, history, currency pairs, trade month, and magic number. Additionally, you can use Custom Date and Custom Comment.
TRADES Tab
This tab displays the current open trades, and in the external variables, you can select the types of columns to display.
There are 21 columns available for displaying statistics.
Column_Number – Shows the trade sequence number in the report;
Column_Symbol – Shows the currency pair of the trade;
Column_Type – Shows the type of order [Which stop was triggered on this trade];
Column_Lot – Displays the trade (position) LOT;
Column_OpenTime – Indicates the opening time of the trade;
Column_OpenPrice – Indicates the opening price of the trade;
Column_CloseTime – Indicates the closing time of the trade;
Column_TimeBetween – Shows the trade hold time in hours and minutes;
Column_ClosePrice – Indicates the closing price of the trade;
Column_SL – Indicates the trade’s stop loss (highlighted if the trade was closed at stop loss);
Column_TP – Shows the trade’s take profit (highlighted if the trade was closed at take profit);
Column_Commission – Shows the commission of the trade (position);
Column_Swap – Shows the swap for the trade (position);
Column_Profit – Shows the result of the trade in the deposit currency;
Column_Points – Shows the result of the trade in points (pips);
Column_NetProfit – Displays the net profit (clean profit = Profit + Swap + Commission);
Column_Percent – Indicates the percentage of net profit relative to the balance at the time of trade closure;
Column_Magic – Displays the magic number of the trade;
Column_Comment – Shows the trade (position) comment;
Column_Balance – Shows the balance obtained after closing the trade;
Column_Max – Indicates the maximum deviation of the trade price in the deposit currency;
Column_Min – Indicates the minimum price deviation in the deposit currency;
Please note! Parameters Column_Max and Column_Min show the maximum and minimum profit in the deposit currency. The analysis is performed by finding the minute bars of the currency pair. For more accurate data, you need to download the entire history of the M1 chart for the currency pair.
Here, you can also filter trades by MagicNumber – Magics.
At the bottom of this tab, you have the option to hide some currency pairs and dates from the statistics. To do this, click on the checkbox next to the name.
Important! You must uncheck (remove the checkmark from) the AllSymbols or AllDates boxes to filter by specific dates or currency pairs (symbols).
HISTORY Tab
This tab displays closed trades from history.
The columns and their visibility can also be adjusted in the settings.
Identical to the TRADES tab.
You can also scroll through the statistics pages if the number of trades does not fit on the screen.
ALL TRADES Tab
This tab displays both closed trades from history and current open trades.
Column names, as well as their visibility, can also be adjusted in the settings.
Similar to the TRADES and HISTORY tabs.
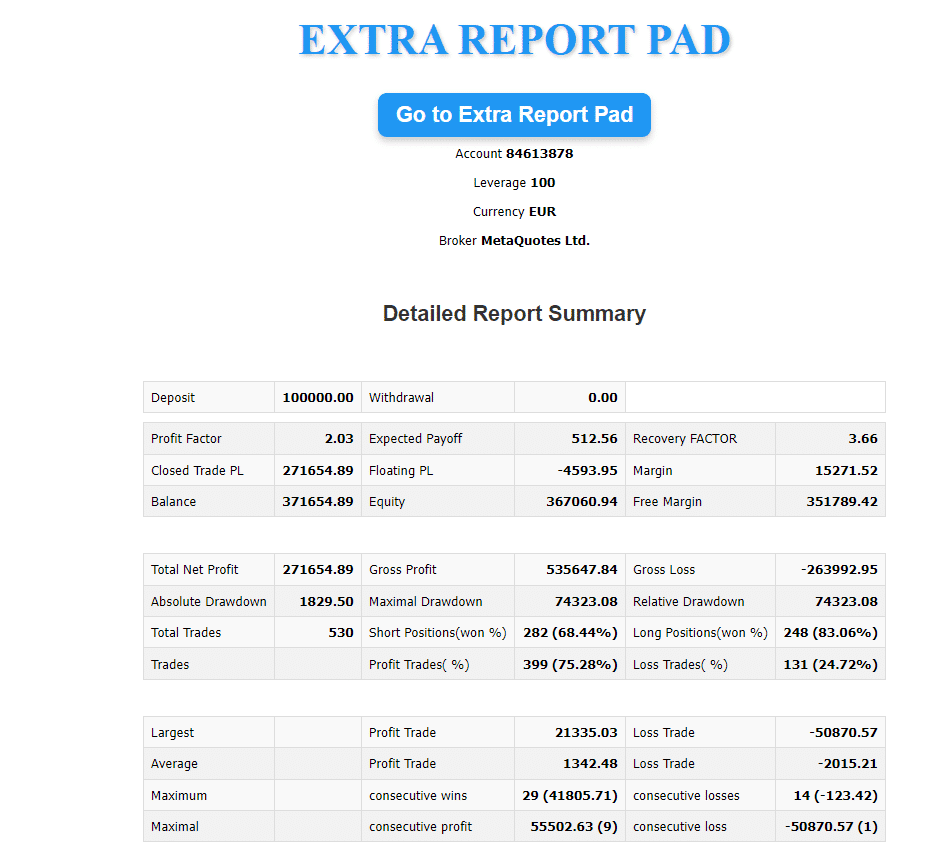
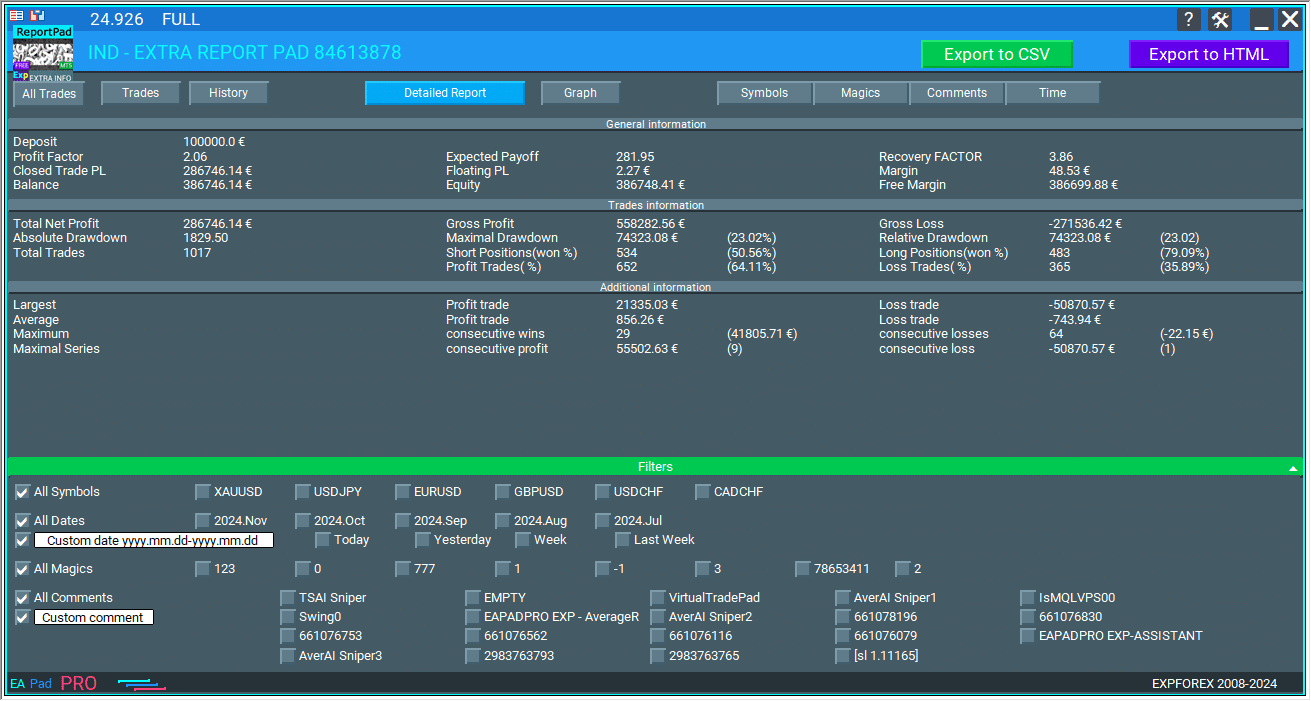
REPORTS Tab
This tab displays the total detailed statistics for your account.
The statistical data are calculated using the exact formulas used in the MT4 report.
Additional data are also calculated using formulas from other resources (e.g., MQL5).
All statistics are displayed in real-time (information updates every 10 seconds. You can adjust this in settings).
You can filter data by symbols, magics, comments, and trade dates:
This tab displays the following basic statistics:
Gross Profit – Total profit, the sum of profits from all profitable trades;
Gross Loss – Total loss, the sum of losses from all losing trades;
Total Net Profit – Net profit, showing the difference between total profit and total loss;
Closed Trade PL – Net profit from closed trades;
Floating PL – Net profit from currently open trades;
Margin – The margin currently in use;
BALANCE – Current account balance;
Equity – Currently available funds;
Free Margin – Current free margin available on the trading account;
Profit Factor – Profitability ratio between total profit and total loss;
Expected Payoff – The mathematical expectation of the win, calculated using the following formula;
Recovery Factor – Calculated as the ratio of absolute profit to maximum drawdown. The higher the recovery factor, the faster the system recovers after a drawdown;
Absolute Drawdown – The difference between the initial deposit and the lowest balance value during the testing process;
Maximal DrawDown – Max of (Maximal Peak – next Minimal Peak);
The percentage of maximum drawdown shows the ratio of the maximum drawdown to the value of the corresponding local upper extremum;
MaxDrawDown% – (MaxDrawDown / MaxPeak) * 100%;
Total Trades – The total number of trades made by an expert during the testing process;
Short Positions (Won%) – Total number of short positions (deals) and the percentage of profitable short positions (Profitable Short Positions / Total Short Positions * 100%);
Long Positions (Won%) – Total number of long positions and the percentage of profitable long positions (Profitable Long Positions / Total Long Positions * 100%);
Profit Trades (% of Total) – Total number of profitable trades and the percentage of the total number of trades (ProfitTrades / TotalTrades * 100%);
Loss Trades (% of Total) – Total number of losing trades and the percentage of the total number of trades (LossTrades / TotalTrades * 100%);
Largest Profit Trade – The largest profit among profitable trades;
Largest Loss Trade – The largest loss among losing trades;
Average Profit Trade – The average profit of profitable trades (GrossProfit / ProfitTrades);
Average Loss Trade – The average loss of losing trades (GrossLoss / LossTrades);
Maximum Consecutive Wins (profit in money) – The maximum number of continuous profitable trades and the total profit from this series;
Maximum Consecutive Losses (loss in money) – The maximum number of continuous losing trades and the total loss from this series;
Maximal Consecutive Profit (count of wins) – The maximum profit from a continuous series of profitable trades and the number of trades in this series;
Maximal Consecutive Loss (count of losses) – The maximum loss from a continuous series of losing trades and the number of trades in this series;
Average Consecutive Wins – The average number of trades in a continuous profitable series;
Average Consecutive Losses – The average number of trades in a continuous losing series.
Graph Tab
Below is a graph showing the change in balance.
Attention! All data is redrawn if you change filters by symbols, comments, magic numbers, or the trade month!
If you want to see it separately for each currency pair,
Check the corresponding checkbox, and the data will be analyzed for the selected currency pair.
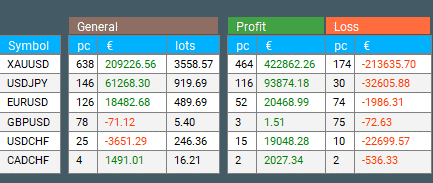
DISTRIBUTION Tab
This tab shows the distribution of trade deals by currency pairs and profit/loss.
The first block shows the number of closed trades: BUY trades and SELL trades. Within each category, it displays the number of profitable trades.
The second block shows the profitable trades in the deposit currency for BUY and SELL separately, and also displays the total lot of profitable BUY and SELL trades.
The third block shows the unprofitable trades in the deposit currency for BUY and SELL separately, and also displays the total lot of loss trades in BUY and SELL deals.
Symbols Tab, Magics, Comments
These tabs display the total data by symbols, magic numbers, and comments.
Conclusions
The Extra Report Pad indicator for analyzing the statistical data of the trading account has proven to be very convenient to use.
The trading account statistical data analysis indicator is very convenient to use after we put a lot of effort into developing it. Extra Report Pad is better than MyFxBook.
You can download my indicator in the Files section!
Thank you for reading the article to the end.
If you wish to thank the author for this project, you can click the Thank You button or buy one of our products.
External Variables and Settings Extra Report Pad
Parameter
Description
AccountHolderName
Defines whether to display the account holder’s name in the HTML report.
false — The account holder’s name will not be displayed in HTML.
true — The account holder’s name will be printed in the report.
RewriteHTMLReport
Determines whether to overwrite the HTML report when saving it.
false — A new HTML report is created with different numbers and names for each click.
true — The HTML report is overwritten each time it is saved, replacing the old report with the new one.
CreateImages
Specifies whether to save images when generating the HTML report.
false — Images will not be created or saved in the HTML report.
true — Images will be created and saved when generating HTML.
DatesOfHistory
Sets the date range of history in the format yyyy.mm.dd-yyyy.mm.dd for generating reports.
Example: “2023.01.01-2023.12.31” — The report will cover trades from January 1, 2023, to December 31, 2023.
Column View Settings
Column_Number
Shows or hides the position number in the table.
true — The position number will be displayed.
false — The position number will not be displayed.
Column_Symbol
Specifies whether to display the financial instrument symbol (e.g., EURUSD).
true — The symbol will be displayed in the report.
false — The symbol will not be displayed.
Column_Type
Shows the trade type (BUY/SELL).
true — The trade type will be displayed.
false — The trade type will not be displayed.
Column_3Lot
Specifies whether to display the lot size of the position (e.g., 0.1 lots).
true — The lot size will be displayed.
false — The lot size will not be displayed.
Column_OpenTime
Shows the time the position was opened.
true — The opening time will be shown.
false — The opening time will not be shown.
Column_OpenPrice
Displays the price at which the trade was opened.
true — The opening price will be displayed.
false — The opening price will not be displayed.
Column_CloseTime
Specifies whether to show the closing time of the trade.
true — The closing time will be displayed.
false — The closing time will not be displayed.
Column_TimeBetween
Shows the time interval between opening and closing a position.
true — The time between open and close will be displayed.
false — The interval will not be shown.
Column_ClosePrice
Displays the closing price of the trade.
true — The closing price will be shown.
false — The closing price will not be shown.
Column_SL
Specifies whether to display the Stop Loss (SL) level.
true — SL will be shown.
false — SL will not be displayed.
Column_SLPoints
Displays the number of points to Stop Loss (SL).
true — The points to SL will be shown.
false — The points to SL will not be displayed.
Show_SLCurency
Determines whether to show the Stop Loss currency.
true — The SL currency will be shown.
false — The SL currency will not be displayed.
Column_TP
Specifies whether to show the Take Profit (TP) level.
true — TP will be shown.
false — TP will not be displayed.
Column_TPPoints
Shows the number of points to Take Profit (TP).
true — Points to TP will be displayed.
false — Points to TP will not be displayed.
Show_TPCurency
Specifies whether to show the Take Profit currency.
true — The TP currency will be displayed.
false — The TP currency will not be shown.
Column_commission
Shows whether to display the trade commission.
true — The commission will be displayed.
false — The commission will not be displayed.
Column_Swap
Specifies whether to display swap fees (charges for holding a position overnight).
true — Swaps will be displayed.
false — Swaps will not be displayed.
Column_Profit
Shows the profit or loss for the trade.
true — The profit will be shown.
false — The profit will not be shown.
Column_Pos
Specifies whether to display the position.
true — The position will be displayed.
false — The position will not be displayed.
Column_NetProfit
Shows the net profit of the trade.
true — Net profit will be displayed.
false — Net profit will not be displayed.
Column_Percent
Displays the percentage profit.
true — Percentage profit will be displayed.
false — Percentage profit will not be displayed.
Column_Magic
Shows the magic number of the trade (if used).
true — The magic number will be shown.
false — The magic number will not be displayed.
Column_Comment
Shows the comment on the trade (if available).
true — Comments will be displayed.
false — Comments will not be shown.
Column_Balance
Specifies whether to display the account balance.
true — The balance will be displayed.
false — The balance will not be displayed.
Column_Max
Sets the maximum value for a column. A value of 0 means no limit.
Column_Min
Sets the minimum value for a column. A value of 0 means no limit.
Other Settings
FilterDepositByTime
Ignores deposits when filtering by time.
true — Deposits will be excluded from the filter.
false — Deposits will be included in the filter.
FilterOnlyif2orMore
Filters trades only if there are 2 or more.
true — Only trades with 2 or more will be included in the filter.
false — Any number of trades will be included, even if there is less than 2.
Debug Settings
OrderHistoryFromTerminal
Specifies whether to load the order history from the terminal or from the library.
true — The history will be loaded from the terminal.
false — The history will be loaded from the library.
UseFilters
Determines whether to use filters or disable them to reduce RAM and CPU load.
true — Filters will be applied.
false — Filters will be turned off to reduce system load.
The indicator for analyzing the statistical data of the trading account turned out to be very convenient to use.
We spent a lot of effort on its implementation.
Thank you for reading the article to the end.
You can download my indicator in the Files section!
If you wish to thank the author for this project – you can click the Thank You button. or buy one of our products
What is Extra Report Pad?
Answer: Extra Report Pad is a professional tool designed for analyzing your trading account effectively. It offers comprehensive statistical analysis in real-time, allowing traders to monitor and evaluate their trading performance with greater precision compared to standard tools like MyFxBook.
How does Extra Report Pad compare to MyFxBook?
Answer: While MyFxBook provides live chart analysis for trading accounts, Extra Report Pad offers a more detailed and 500% more information through its HTML reports. It not only analyzes open and closed trades but also provides in-depth statistical data and monthly performance insights, making it a superior choice for professional traders.
What are the key benefits of using Extra Report Pad?
Answer: The key benefits of Extra Report Pad include:
Real-time Analysis: Provides up-to-date statistics and data.
Comprehensive Reporting: Generates detailed reports with extensive information.
Customization: Allows filtering by symbols, dates, magic numbers, and comments.
Ease of Use: Integrated into the MetaTrader terminal for seamless access.
Enhanced Statistics: Offers more in-depth analysis compared to standard reports.
How can I export my trading data using Extra Report Pad?
Answer: Extra Report Pad allows you to export your trading data in both HTML and CSV formats. By clicking the EXPORT to HTML button, you can generate a detailed report filtered by your chosen criteria (e.g., specific currency pair, magic number, or month). The exported files are saved in the YOUR TERMINAL \ MQL4 \ Files \ EXTRAREPORTPAD directory, making it easy to access and review your trading performance outside the MetaTrader platform.
What types of filters are available in Extra Report Pad?
Answer: Extra Report Pad offers several filtering options to customize your analysis:
Filter by Symbol: Select specific currency pairs.
Filter by Date: Choose particular trading periods.
Filter by Magic: Filter trades based on magic numbers.
Filter by Comment: Sort trades by comments.
Custom Date and Comment: Create personalized filters for more precise analysis.
These filters help in isolating and examining specific aspects of your trading performance.
Can Extra Report Pad handle multiple currency pairs simultaneously?
Answer: Yes, Extra Report Pad is designed to manage and analyze multiple currency pairs simultaneously. It allows traders to monitor several trades across different pairs at once, making it essential for modern trading strategies that involve trading multiple currencies simultaneously. The tool simplifies the complexity of handling numerous trades by providing detailed and organized statistical data.
What are the available languages for Extra Report Pad?
Answer: Extra Report Pad supports multiple languages to cater to a diverse user base. The available languages include:
English
Ukrainian
Portuguese
Spanish
Italian
French
German
Chinese
Japanese
Korean
Turkish
This multilingual support ensures that traders from various regions can utilize the tool effectively.
How does Extra Report Pad enhance trade analysis compared to standard MetaTrader reports?
Answer: Standard MetaTrader reports lack detailed data on individual trades, profitable currency pairs, and monthly statistics. Extra Report Pad addresses these limitations by providing:
Detailed Trade Data: Comprehensive information on each trade, including open/close times, prices, profit/loss, and more.
Monthly Analysis: Breaks down trade performance by month for better trend analysis.
Advanced Statistics: Calculates metrics like profit factor, recovery factor, drawdowns, and more.
Real-Time Updates: Continuously updates data every 10 seconds, ensuring traders have the latest information.
These enhancements enable traders to perform a more thorough and professional analysis of their trading activities.
Is Extra Report Pad easy to install and integrate with MetaTrader?
Answer: Yes, Extra Report Pad is designed for seamless integration with the MetaTrader terminal. Installation involves placing the indicator files in the MQL4(5) \ Indicators directory. Once installed, the tool appears as an integrated panel within MetaTrader, allowing easy access to all its features without disrupting your trading workflow.
What support and resources are available for Extra Report Pad users?
Answer: Users of Extra Report Pad have access to various support and resources, including:
Comprehensive Documentation: Detailed guides and instructions on using the indicator’s features.
Downloadable Files: Easily accessible indicator files available in the Files section.
Customer Support: Assistance for any technical issues or queries.
Community Resources: Links to related products and additional tools like VIRTUALTRADEPAD and EAPADPRO for enhanced trading analysis.
Additionally, users can express their appreciation by clicking the Thank You button or purchasing other products, fostering a supportive community around the tool.
Changelog Extra Report Pad
Version 25.3102025.03.14
he "Symbol Representation, Magics, Comments" tabs now exclude rows with zero values!
Added the AutoSize parameter — automatic font size adjustment to fit the screen width when the indicator is initially set.
The AutoSize limit has been increased to 25.
Version 25.1112025.01.12
EAPADPRO v61
We are excited to introduce new languages to our functionality. Users can now enjoy an even wider range of language options for their convenience and comfort. Here’s the list of newly added languages:
THAI=12 — Thai
INDI=13 — Hindi
MALAY=14 — Malay
INDONEZIA=15 — Indonesian
ARAB=16 — Arabic
VETNAM=17 — Vietnamese
BALKAN=20 — Balkan
POLAND=21 — Polish
CHEZH=22 — Czech
Update your application and enjoy working in your native language! ????
Version 24.9262024.09.26
-- Modified data markup in the Filters block.
Version 24.924 2024.09.22
— When loading the indicator onto the chart, trading levels and trading history are now disabled to prevent overlapping objects.
— Added Stop Loss and Take Profit values in the deposit currency to the Stop Loss and Take Profit fields (Show_SLCurrency and Show_TPCurrency in the settings).
— Introduced a parameter for filtering history by a custom date:
DatesOfHistory = “Custom date yyyy.mm.dd-yyyy.mm.dd”; // Custom Dates of history Start-End: yyyy.mm.dd-yyyy.mm.dd
Set in the format: StartYear.StartMonth.StartDay-EndYear.EndMonth.EndDay.
You can forcibly specify the history period that the indicator will use.
For example: 2024.09.15-2024.09.21
Version 24.921 2024.09.21
— Compiled for the latest versions of MetaTrader terminals.
— Minor bug fixes to enhance performance.
— Major overhaul of language translations.
— New languages added: Ukrainian, Portuguese, Spanish, Italian, French, German, Chinese, Japanese, Korean, and Turkish.
— HTML reports can now be generated in multiple languages, with all words and phrases translated into the 12 main interface languages.
— Significant improvements to HTML reports:
— — Enhanced user interface for better usability.
— — Added histograms to “Overview” tables, displaying key metrics categorized by comments, magic numbers, and symbols.
— — The history table is now paginated for improved readability and reduced system resource usage.
— — Columns in the history table can now be sorted by selected parameters.
— — A search feature has been added to the history table, allowing users to find specific tickets in the report.
— — The balance graph is now interactive, displaying additional information when hovering over points, showing balance details for the selected time.
Version 23.913 2023.09.20
-EAPADPRO v44
-Last Build Compilation
Version 22.121 2022.01.19
Update Update
Version 22.120 2022.01.19
-Updating the design of the HTML report.
Version 22.119 2022.01.18
Update Update
Version 22.118 2022.01.18
Update filtering by comments.
All [sl] [tp] comments will be moved to a single group to the main comment:
Correction of a report error when calculating Profit Trades in the presence of Pending Orders that are different from
“canceled “comments.
Version 21.944 2021.11.12
Optimization of the code and the speed of the indicator.
Version 21.943 2021.11.11
Update Update
Version 21.942 2021.11.10
Update for Last build MetaTrader4
Version 21.941 2021.10.10
Версия 21.941
Version 21.940 2021.10.10
– Modification of the drawing function to increase the speed of the History tabs!
– Increased the speed of the indicator due to the use of CACHE account history data.
– Added Debug functions to explore ways to minimize system load.
Version 21.910 2021.09.08
FixFixFixFix
Version 21.909 2021.09.08
Metaparameter for Excel added to CSV Export: sep =; to correctly define the “Separator” for our CSV report;
Version 21.908 2021.09.07
The “Chart” section, when using filters, can now show the balance line separately for the selected filters, without taking into account the change in the total balance on the account.
Version 21.907 2021.09.07
Улучшение отображение графика
Version 21.906 2021.09.06
-Added Graph Tab: Displaying a balance graph based on your trading account.
The balance chart is built on the basis of the History of trade deals and the selected filters!
When exporting a report to HTML, the balance chart will be additionally saved.
Balance chart added to HTML report!
-General performance and graphics improvements.
Version 21.613 2021.06.13
-New sections have been added to the Dates filter block: Today / Yesterday / Current week / Previous week;
–Attention: For correct filtering of this data, it is necessary that the indicator be set to a symbol with a loaded history of quotes (at least for a month)
-Added a subsection to the “Time” block – Lots by day / week / month, displaying the profitability of such data.
-Changing the color scheme of the “Time” section for a more understandable display of information;
-Updating EAPADPRO, according to the new rules for using the MQL5 Market;
Version 21.605 2021.06.03
Optimization of the code and a significant increase in the performance of the indicator.
Version 21.601 2021.06.02
– MT4Orders update for Ind version – ExtraReportPad MT5;
– Added parameter FilterOnlyif2orMore – Take into account and form the list of comments / magic in filters only if there are 2 or more identical deals in the comment / magic.
Previously, we did not take into account the comment / magic of only 1 deal in the filtering (Filters tab),
since some advisors use the comment / magic field as a unique ticket number!
In order not to overload the filter system,
we have not included such single trades for filters.
– Added all deals of one comment with the prefixes [sl] and [tp] to the filtering mode by comments
– Added “Export to CSV” button – exports text data to Excel – CSV format!
For some needs and requests, we made a report output in CSV format – this format is needed to form your own criteria in Excel tables.
This mode is not as pretty as the HTML report, but it is suitable for generating your own reports from the data!
– Added restriction on the number of filtered items to the filter tab.
– Sorted in Symbols / Magics / Comments from highest to lowest.
Also filter names by Symbol / Magic / Comment are sorted from highest to lowest.
Version 21.1 2021.01.11
– Added the FilterDepositByTime parameter: When using the time filter, the deposit / withdrawal of funds that do not fall into the time filter are removed from the report.
To filter deposits / withdrawals by time, use FilterDepositByTime = true;
Attention! It is not recommended to enable filtering of deposits / withdrawals because it may affect the calculated data and statistics output.
– Added lots to the TIME table (Time report), when you hover over the data columns, the amount of lots is shown in the tips!
Version 20.935 2020.10.15
– Added the ability to rewrite HTML data file for use in EXCEL RewriteHTMLReport:
true = Overwrite HTML file on export.
false = Old version, adds a unique report number to the end of the file name.
–Fixed error in displaying current open deals when using the CustomDate parameter
Version 20.225 2020.02.26
–Added parameter CreateImages: Save / Do not save images when creating an HTML report.
– When scanning the history, the indicator will automatically add currency pairs that are not in the “market watch”, but are in the “Account history”.
Attention: For the indicators to work properly, you must add all currency pairs (Symbols) to the “market watch”
Version 20.210 2020.02.10
– Increased data processing speed on accounts with a large history> 1000 positions in history.
– Added LABEL that data is being updated and needs to wait.
– Calculation of Maximal DrawDown and Recovery Factor updated
Version 20.209 2020.02.09
–Table separation for HTML report:
Now Open Trades and History Trades are different tables.
For ease of import into Excel
–When saving the report in HTML, images are also saved for easy upload to different sites.
Version 19.816 2019.08.16
0. Added the ability to specify the reporting period in Filters in the format: yyyy.mm.dd-yyyy.mm.dd
Attention! Carefully check the date request format: yyyy.mm.dd-yyyy.mm.dd, for example: 2018.05.25-2018.12.25
1. Added variable AccountHolderName = Print the name of the account holder in HTML!
3. A line has been added to the Current open positions tab with a total statistics of all open positions.
4. Fixed error updating the list of open positions. Data is recalculated when changing the list of open positions.
5. Max and Min balance, the algorithm is updated! The indicator starts to count from the next minute bar after opening a position.
6. In the statistics of open positions added time retention of current open positions!
7. Added unit selection (deposit currency, points) in Column_Max and Column_Min columns.
8. When you create an HTML report, the selected filters will be added to the end of the report!
Version 19.315 2019.03.15
FixFixFix
Version 19.314 2019.03.14
FixFixFix
Version 19.313 2019.03.13
Increased speed and accuracy.
Version 18.989 2018.12.10
Maximal DrawDown FIX
Version 18.964 2018.11.08
Исправлена ошибка загрузки индикатора на счет, где отсутствуют комментарии
Version 18.914 2018.09.14
The error of profit display on some accounts with the commission is corrected.
Version 18.828 2018.08.28
Statistics will be collected only when the window with the indicator is active!
Changed the function Scrolling.
Filter function by comment is changed. Only the 20 most frequently used comments will be shown.
Changed the color scheme of the HTML page (highlighting the Stoploss / TakeProfit closing), Leveraged currency pairs are highlighted.
Fixed bugs reported by users.
Version 18.827 2018.08.27
Sort by date modified. If the position was opened last year, then the filter is carried out over the past year.
Added filters for comments (Warning: The filter gets those comments that have more than 1 position in the history.)
Added filter for user comment (Just enter part of the comment, the indicator looks for all positions where the comment contains user-defined text, for example Copy_)
Version 18.820 2018.08.20
Full redesign of the indicator!
Version 16.906 2016.09.19
Fixed errors.
Added the ‘EXPORT to HTML’ button downloading the entire report from the chart to a separate HTML file.
All trades are sorted by the filters applied in the panel.
For example, you can select only one currency pair, a certain magic number or a certain month.
The generated report is to contain only sorted data.
The report file is generated in the folder: YOUR TERMINAL MQL4 Files EXTRAREPORTPAD EXTRAREPORTPAD Account number.html
Version 16.405 2016.04.07
Added the ‘Distribution Time’ tab for distributing the trades by hours, days and months. with an indication of profit and loss.
This indicator is amazing. It also has the max upside watermark and the lowest drawdown that was in profit per trade. Compare it to the actual profit or loss, then use an EA like Account Protector and tell it to take profit or stop loss at the average high watermark and stop loss at at the lowest above the largest drawdowns. It will increase your profits and mimimize your losses. just review your trades daily or weekly and you will find this tool invaluable. And the reports are far better than Metatraders. And it gives you a report analysis of all your trades with win and lose rate, profit ration, lowest overall drawdown, etc. You can also filter your trades by comment or magic number to get a drilled down deeper insight. Great job author!
Very good reporting tool - could I ask that in the Export to HTML Magics section to add the comments column? That way it makes it easier to correlate the magic number to the specific EA or trade comment without having to cross match them manually another way.
overall good indicator, delivery valuable information. My only criticism is the CSV export can use some improvements or maybe change it to excel format where you can do much more, otherwise love it.
"Thank you for your feedback! We're glad you find the indicator valuable. Regarding CSV export, MQL only supports CSV format, but it is specifically structured for Excel compatibility. You can easily open it in Excel and work with the data as needed. Let us know if you have any other suggestions!"
The indicator is very intuitive and detailed, suitable for synthesizing long-term performance Hopefully the author can add functions such as: deleting comments, magic number in the indicator's filter list (because after a long time the number will exceed the screen), creating a chart showing Equity/Balance (profit/loss) of the account over time in history.
Jcb Mlwijk
Excellent reporting functionality that provides you with detailed insights into their trading performance. The tool generates trade history reports, including key metrics such as profit/loss analysis, drawdown, and risk exposure.
Ron Inchess
Really useful product, just what I was looking for. The author's site is also interesting. Worth a visit. Some difficulty in configuring the MT5 dimensions. The reports to download are excellent and clear. Very useful for work evaluations.
-
Prodotto veramente utile, proprio quello che cercavo. Anche il sito dell'autore è interessante. Da visitare. Qualche difficoltà a configurare le dimensioni di MT5.I reports da scaricare sono ottimi e chiari. Molto utili per le valutazioni di lavoro.
cbarryftmo
At last, I've discovered exactly what I needed! I'd been searching for a tool to assess the performance of various EAs over time, but couldn't find one. The program I downloaded earlier lacked the feature to label prices traded by specific EAs. This tool fulfills my requirement perfectly. I'm extremely grateful for the expertise behind its development and the superior ability to download information. Thank you so much!
Yong Chan Kow
Very useful. It can generate reports that include magic numbers, comments and other fields. This enabled me to analyse performance from various angles.
hwschmidt
Tolles Tool. Sehr viele Informationen die man bisher nicht hatte. Für mich besonders gut weil ich die Daten jetzt besser nach Excel übertragen kann ohne das die Formatierung leidet. Danke
Hristo
Fantastic tool, much better than anything I have seen on the market. I am not sure how the filtering at the bottom is working, for example when clicking on just one Magic number it does say Updating at the top, but the table remains the same with the previous information on it, also if there could be an option to Sort from A-Z / Bigger-Smaller...etc on the actual panel that would be amazing. Also not sure if it has already this function but to be able to display the number of pips/points per magic number or comment would be great because this way easily EA's can be compared between two different platforms with different balance lot sizes. Anyway, it is the best tool I have seen so far. Well done to the developer. Great job.
Alex Candela 2022.12.21 19:53
Es una buena herramienta, hay que tener un poco de paciencia al cargar datos, pero cumple su cometido por el "precio" que tiene. Muchas gracias por la utilidad!!!
Yusuf Mansawala
It's a useful tool for Fund Mangers and Clients trading with multiple signals or multiple copy trading services, as it can sort out your account statement into a powerful decision making tool.
I Made Gede Arjana 2022.02.26 03:28
Thank you. It's a great tool. It will be perfect, if you add the feature to show the trade position at the certain of date including details of floating order, pending order, balance, equity, margin, free margin, margin level.
rav5612 2022.02.06 01:55
quite usefull BUT i'd prefer a trade manager who controls BASKETS, instead this indicator can only observe individual trades.Pity
Timothy Joseph Derkitt 2022.01.28 05:02
Thank you Vladislav, I was wondering how I was going to analyze my strategy which involves trading 28 pairs on one magic number on a 1 minute timeframe and 28 pairs on second magic number on a 10 minute timeframe. This is the solution. Well done!
Viktor Bobrov 2022.01.13 16:20
Нужная вещь. Но шрифт на моём экране очень мелкий. Может потому-что у меня 4к. Хотел добавить скрин но не нашел , как это сделать.
Владислав Спасибо за подсказку , всё получилось .Спасибо !
За оперативность тоже Спасибо!
Maksym Steplyuk 2021.11.08 14:01
Thank you. That report pad is super cool and exactly what I was looking for. I love report by comments. that in simple way demonstrate effectivness of each EA I am testing. I have only one request if possible. On the summary report by magic and by comments Add please average performance per day.
Ramego 2021.10.22 11:27
Очень полезная вещь! Спасибо большое за ваш труд! P.S. Мне не хватает фильтра по сортировке суммы лотов открытых ордеров как для лонгов так и для шортов. Такой фильтр необходим для хэджирования если много маленьких ордеров застряли в минусовой территории (например исправлять "косяки советника" в ручную 🙂
Gladiator WXT 2021.10.09 13:50
Утилита в целом хорошая, но есть несколько недостатков, мешающих пока поставить 5. 1. Сильно тормозит ПК, постоянно жрет ресурсы. Рекомендую сделать настройки "Период обновления" с заданием стандартных MT5 тайм-фреймов по выбору пользователя, это позволит регулировать нагрузку. 2. Нет кнопок для быстрого закрытия позиций, или закрытия всех позиций.
Спасибо за честность. Панель обновляется редко и это регулируется в настройках панели. 2. Это индикатор, он в принципе не может торговать. Это информационный индикатор. Вы что-то перепутали.
Shine Scariah 2021.06.08 08:50
Dear Friend, Thank you for the nice Tool.
I am giving Rating 4 as it is excellent but can still be improved. Will inform further in due course of time
Mostafa Au Ismail 2021.06.01 07:04
This is an excellent tool. I cannot wait to get the updated version to export to excel, even if I have to pay for it.
Update: I see the export to cSV files option has been added. Great. I hope it will work smoothly.
Andigho 2020.12.22 16:56
This is a fabulous indicator. Personally speaking, it is the most comprehensive reporting tool i have found in the market. The best part is, it updates in real time. I don't have to run the application every time i want to see an updated report - fantastic! As you plan future updates, could you kindly add percentage growth in the Detailed Report Tab? I think information about the percentage growth of the account for the specific period chosen is essential to account reporting. Thanks again for your hard work.
David Little 2019.07.01 18:02
Very Glad I came across this reporting tool! I too had a bit of a learning curve about what was (and wasn't) showing in the report, but a few exchanges and I was educated on how it works. Greatly appreciate your efforts and in sharing such a tool!!!
Any way of allowing only one trade to show up on the report?
Fabrizio Malavasi
This reporting app it's a very useful tool to analyse the trades order history.The "Time" button that show the profit/entry along the time It's interesting too. It has a very nice graphic form. You made as usual an excellent job!
Thanks a lots!
Kristina Suh 2018.09.14 09:51
Amazing support. I had an issue with the display of the Money value.
He fixed it in minutes and updated the file..
Great job.. Thanks 🙂
Alexander Jeffrey Klein 2018.08.28 13:29
Wonderful reporting tool. Had an issue at first whereby not all trades were showing but after a couple of email exchanges with Vladislav, he kindly reviewed it and fixed my issue. Very helpful and prompt in getting back.
Thank you and wish you well.
Megatrader777 2018.08.20 16:35
Отличный индикатор. Есть некоторые помарки, но в целом - отличный инструмент для анализа счета.
myfxbook на графике в реальном времени
Sergey Demin 2017.02.28 09:19
Хорошая работа.
Как и все работы Автора.
Заказываю себе советники у Владислава - всегда будет сделано лучше, чем мое техническое задание.
Сильно рекомендую данного программиста. ОСОБЕННО, если у вас серьезные требования.
I have installed version 25.310 of the Report Pad software on MetaTrader 4 version 1441 on a desktop with the Win11 operating system and it works fine, but when I install the same version on MetaTrader 4 version 1441 on a VPS with the Win Server 2012 operating system, it does not work and does not run at all. Why? What should I do?I also have Microsoft Visual C++ Redistributables installed on my VPS system, so there is no problem with that. Please advise me on what I need to do to run this Report Pad.
Hello. Unfortunately, I can’t tell you the reason for the error, since I don’t have VPS 2012. There was a message on the forum that at least 2018 Server is supported. Check it out
SAFETYLOCK: Secure Your Trades Against Sharp Market Reversals
Trading on financial markets involves high risks, particularly during sharp market reversals. SAFETYLOCK…
Auto Setting stop loss, take profit, trailing stop, breakeven levels, enabling virtual stops.
Exp Assistant will help you organize maintenance of your…
Closing unprofitable positions by identifying and closing profitable ones.
The Expert Advisor (EA) is designed to close unprofitable positions by identifying…
Universal trading adviser on custom indicators for MetaTrader .
Exp – The xCustomEA Universal trading advisor on custom indicators. The xCustomEA works on…
Lorem ipsum dolor sit amet, consectetur adipiscing elit, sed do eiusmod tempor incididunt ut labore et dolore magna aliqua. Ut enim ad minim veniam, quis nostrud exercitation ullamco laboris nisi ut aliquip ex ea commodo consequat. Duis aute irure dolor in reprehenderit in voluptate velit esse cillum dolore eu fugiat nulla pariatur. Excepteur sint occaecat cupidatat non proident, sunt in culpa qui officia deserunt mollit anim id est laborum.


Leave a Reply