銀行、証券会社、取引所などへのリンク

初心者のための外国為替取引パート 10: 数学的分析、指標

反転パターン、スター、ハンマーとハンギング、その他の反転パターン、トレンド継続パターン、日本のテクニカル分析の主な規定、価格の高値と安値からのギャッププレイ。
反転パターン
ハンマーとハンギングマン (Hammer and Hanging Man)

ハンマーキャンドル:
ボディは価格帯の上部に位置します。ボディの色は重要ではありません。
下ヒゲはボディの2倍の長さです。
キャンドルには上ヒゲがないか、非常に短いです。
強化要因:
下ヒゲが長いほど、上ヒゲが短いほど、ボディが大きいほど、潜在的な力が増します。
ボディの色は重要ではありませんが、強気色のハンマーはより強気の可能性を示し、弱気色のハンギングマンはより弱気の可能性を示します。
特徴:
(色は重要ではありません。)
ハンギングマンの場合、弱気信号の確認が重要です。ハンギングマンのボディと次の期間の始値との間の下方向の価格ギャップが大きいほど、ハンギングマンがトップを形成する可能性が高まります。弱気の性質のもう一つの確認は、ハンギングマンが現れた日の終値よりも低い終値を持つ黒いキャンドルです。
前の価格動向がハンマーを特徴付けます。ハンマーの前に明確な弱気のサインを持つキャンドル(例えば、影のない長いボディ)が現れた場合、これは弱気市場が強まっている証拠であり、次のキャンドルがハンマーの終値よりも高い終値を持つなど、強気が状況を掌握していることの確認を待つ必要があります。重要なサポートレベルをハンマーが突破したかどうかを監視することが重要です!
吸収モデル (Absorption Model)

説明:
市場には明確なトレンドが存在しなければなりません(短期的でも)。
2つのキャンドルがパターンを形成します。2番目のボディは1番目を吸収しなければなりません(影は考慮しません)。
2番目のボディは対照的な色であるべきです。唯一の例外は、ボディが非常に小さく、ドージと同等かドージである場合です(下降トレンドで非常に大きな白いボディによる小さな白いボディの吸収、上昇トレンドで非常に大きな黒いボディによる小さな黒いボディの吸収)。
強化要因:
- · 最初のキャンドルは非常に小さなボディを持ち、2番目のキャンドルは非常に大きい。
- · 長期または非常に急速なトレンドの後に包み込みパターンが現れる場合。
- · 2番目のキャンドルがより大きな取引量に対応している場合。
- · 2番目のキャンドルが複数のボディを吸収している場合。
雲の中のクリアランス (Clearance in the Clouds)

説明: 最初のキャンドルは黒で、2番目のキャンドルは前のキャンドルの安値を大きく下回って開きます。
サインは「ダーククラウドカバー」パターンと同じですが、ダーククラウドカバーでは例外があり得る(2番目のボディが最初のボディの半分以上をカバーしない場合がある)一方で、ギャップには例外がありません!2番目のキャンドルのボディは最初のキャンドルのボディの半分以上をカバーする必要があります。
その理由は、2番目の強気キャンドルが最初のキャンドルのボディの半分未満をカバーする場合、弱気トレンドの継続のための3つのモデルが存在するためです:

| 1 “ボトム”パターン (Bottom Pattern) (始値が前の黒いキャンドルの終値よりわずかに高い) | 2 “ボトム”パターン (Bottom Pattern) (始値が前の黒いキャンドルの終値よりわずかに高い) | 3 “ボトム”パターン (Bottom Pattern) (始値が前の黒いキャンドルの終値よりやや高い) |
これらのパターンと価格がチャート上で形成され、その後白いキャンドルの安値を下回る場合、売りのタイミングです。
スター (Stars)

スター (Star) は、小さなボディ(任意の色)のキャンドルで、前の大きなボディのキャンドルとの間に価格ギャップを形成します。キャンドルのボディ間のギャップがスターの形成の主な条件です(影は考慮しません)。
スターは4つの反転パターンの一部です:
- イブニングスター (Evening Star)
- モーニングスター (Morning Star)
- ドージスター (Doji Star)
- フォーリングスター (Falling Star)
- 基底部の反転パターン (Reversal Pattern at the Base)

3番目のキャンドルは最初のキャンドルのボディの重要な部分をカバーします。理想的には、スターのボディと最初および3番目のキャンドルとの間に価格ギャップがあります(影は考慮しません)が、必須ではありません。
イブニングスター (Evening Star)
モーニングスターの弱気対応物です。

イブニングスターは特に上昇トレンドの終わりに重要ですが、取引レンジのトップ(レジスタンスレベル)でも発生することがあります。
モーニングスターとイブニングスターの強化要因:
- スターと隣接する2つのキャンドルとの間にギャップが存在する。
- 3番目のキャンドルのボディが最初のキャンドルのボディの重要な部分をカバーしている。
- 最初の取引セッション中の取引量が少なく、3番目のセッション中の取引量が多い。
イブニングまたはモーニングドージスター (Evening or Morning Doji Star)

ドージスター (Doji Star) は通常のスターよりも重要です。なぜなら、ドージが含まれているからです。ただし、ドージの後に価格ギャップを形成するキャンドル(上昇トレンドでは白、下降トレンドでは黒)が現れた場合、ドージは弱気または強気の信号ではなくなります。
最も強力な信号は“アバンドンドベイビー (Abandoned Baby)”です。これは、ドージスターと隣接するキャンドルとの間に価格ギャップがあり、影さえも交差しないことが特徴です。
フォーリングスター (Falling Star)

フォーリングスター (Falling Star) のボディは小さく、キャンドルの価格範囲の下部にあります。上ヒゲが長いです。他のスターと同様に、フォーリングスターのボディの色は重要ではありません。
このモデルは価格の上昇の終わりの可能性を警告します。イブニングスターとは異なり、最も重要な信号の一つではありません。理想的なフォーリングスターのボディは前のキャンドルのボディとの間にギャップを形成しますが、必須ではありません。
インバーテッドハンマー (Inverted Hammer) はフォーリングスターに似ており、強気の信号を確認するために待つ必要があります。例えば、次のオープンがインバーテッドハンマーのボディよりも高い場合や、より高い価格レベルの白いキャンドルが確認された場合です。
その他の反転パターン
ハラミ (孕むハラミ) (Harami)

前のキャンドルの長いボディ内に小さなボディを持つキャンドルです。
このモデルは吸収モデル (Absorption Model)の逆です。ハラミは強力な信号ではなく、トレンドの終了の可能性を警告するだけです。ハラミのキャンドルは必ずしも色が異なるわけではありませんが、ほとんどの場合、対照的です。影は重要ではありません。
クロスハラミ (Cross Harami)

クロスハラミ (Cross Harami) パターンでは、2日目に小さなボディを持つキャンドルの代わりにドージが現れます。クロスハラミは強力なドージの存在により、最も重要な反転信号の一つです。クロスハラミパターンは基底部でも形成されますが、トップでの方が効果的です。
トップとボトム “ツイーザー” (Tops and Bottoms “Tweezers”)
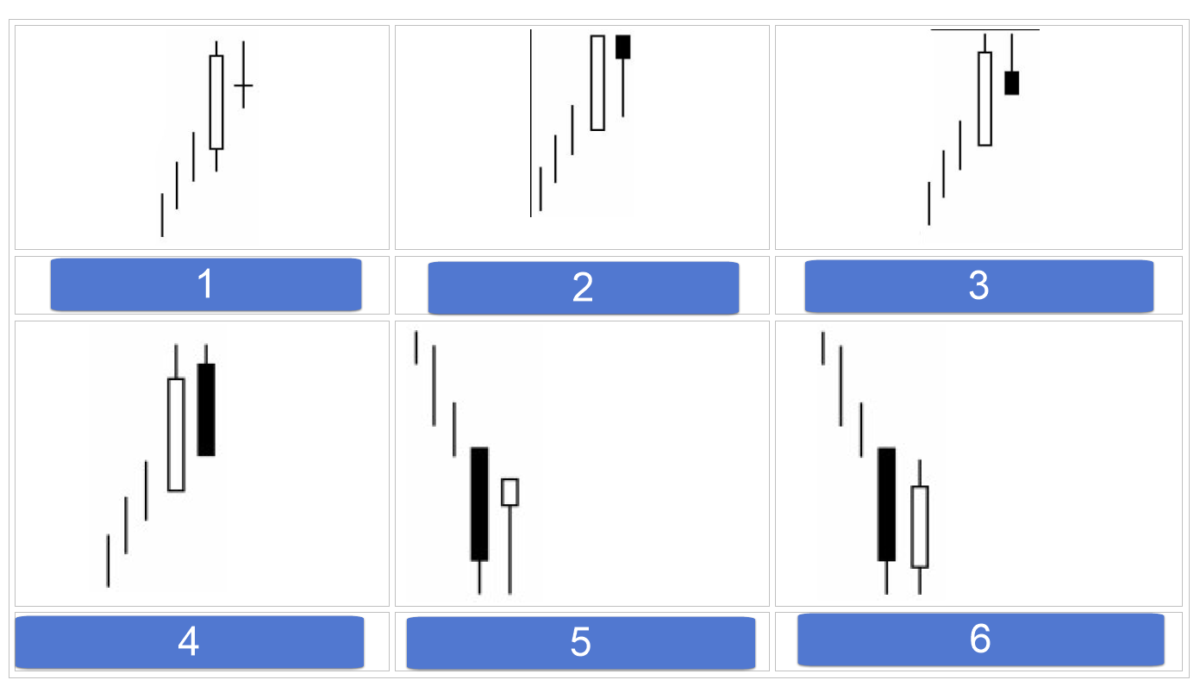
ツイーザーパターンは、同じ高値(上昇トレンドの場合)または同じ安値(下降トレンドの場合)を持つ2つ以上のキャンドルから構成されます。影、ボディ、またはドージがツイーザーを形成することがあります。連続または近い取引セッションで作成されます。通常、強力な反転信号ではありません。長いトレンドの後に現れた場合や、他のキャンドル信号がそれらの弱気(トップ)または強気(ボトム)の性質を確認する場合、その重要性が増します。
以下の要因がそのような信号の例として機能することがあります:

| 1 | 2 | 3 |
| ツイーザースピーク (Tweezers Peak) と クロスハラミ (Cross Harami) | ツイーザースピーク (Tweezers Peak) と クロスハラミ (Cross Harami) | ツイーザースピーク (Tweezers Peak) と クロージングスター (Shooting Star) |
| 4 | 5 | 6 |
| ツイーザースピーク (Tweezers Peak) と クロスハラミ (Cross Harami) | ツイーザーピナクル (Tweezers Pinnacle) と ハンギングマン (Hanging Man) | ツイーザースピーク (Tweezers Peak) と シューティングスター (Shooting Star) |
追加の信号として、これらのパターンによるレジスタンスまたはサポートレベルの成功裏のテストが挙げられます。
ツイーザーのトップとボトムは、週足および月足チャートでより重要な信号となります。この場合、他のキャンドル信号による確認を待つ必要はありません。
ベルト保持モデル (Hold by the Belt Model)

強気の保持は、下降トレンド中に現れる長い白いキャンドルで、下ヒゲがあります。弱気の保持は、上ヒゲのある長い黒いキャンドルです。
キャンドルにはヒゲがありません(強気キャンドルの場合は下ヒゲ、弱気キャンドルの場合は上ヒゲ)、またはヒゲが非常に小さいです(数ティック)。
キャンドルが長いほど、市場のその後の動向にとって重要です。これらのキャンドルは、チャート上に長期間現れていない場合に最も重要です。信号は、弱気の保持の場合は次の終値が上に、強気の保持の場合は次の終値が下に来ることでキャンセルされます。
二羽の飛ぶカラス (Two Flying Ravens)

「飛ぶ」は、最初の黒いキャンドルの小さなボディと前のキャンドルのボディとの間の価格ギャップを指します(通常、最後のキャンドルは長い白いボディを持っています)。「カラス」は2つの黒いキャンドルから構成されます。パターンは弱気です。理想的には、2番目のカラスの始値は1番目のカラスの始値よりも高く、終値は1番目のカラスの終値よりも低いです。このモデルの重要性は、4番目の取引セッションで価格が上昇に失敗した場合、価格が下落することが予想される点にあります。
タタミ保持 (Hold on Tatami)

このパターンは「二羽の飛ぶカラス」に似ていますが、強気の信号です。
最初の3つのキャンドルは「二羽のカラス」パターンに似ていますが、その後にもう一つの黒いキャンドルが続き、その後に前のキャンドルの高値(上ヒゲ)を上回る始値(ギャップ)または黒いキャンドルの高値を上回る終値を持つ白いキャンドルが現れます。「保持」は3つではなく2つのカラスを含む場合があります。
「二羽の飛ぶカラス」と「タタミ保持」は非常にまれです。
三羽の黒いカラス (Three Black Crows)

説明:
連続して下落する三つの黒いキャンドル。高値域または長期の上昇トレンドの後に現れると、価格の下落を予測します。三羽のカラスの終値は安値またはそれに近い必要があります。各キャンドルの始値は前のキャンドルのボディ内にある必要があります。
強化要因:
- 三羽のカラスの最初のキャンドルのボディが前の取引セッションの白いキャンドルの高値よりも下にある。
- 二羽目および三羽目のカラスの始値がそれぞれ一羽目および二羽目のカラスの終値と同じである。
「カウンターアタック」モデル (Counterattack Model)

二つの対照的なキャンドルが同じ終値でカウンターアタック (Counterattack) パターンを形成します。これは「雲の中のクリアランス」および「ダーククラウドカバーパターン」に似ており、同じキャンドルの組み合わせで構成されています。しかし、カウンターアタックでは2番目のボディが1番目と重ならず、「クリアランス」と「ベール」パターンが強力な信号となります。
強気のカウンターアタックはボトムパターンに似ていますが、白い強気カウンターアタックキャンドルは始値がずっと低い(非常に長い)ため、カウンターアタックは反転パターンであり、ボトムは継続パターンです。主な条件は、2番目の取引セッションの始値が前のキャンドルよりも大幅に低い(強気カウンターアタック)または高い(弱気カウンターアタック)ことです。
長期間を要する反転パターン:
「三つの山」パターン (Three Mountains)
西洋のトリプルトップモデルに似ています。重要な反転パターンはトップで形成されます。価格が同じ高値に3回到達するか、新しい高値に3回到達しようとする場合に形成されます。最後の山の頂点は、弱気パターンまたはキャンドル(例:ドージやダーククラウドカバー)によって確認されるべきです。

「三つの仏」1 (Three Buddhas 1)
西洋のヘッドアンドショルダーズパターンに似ています。

| 1 | 2 |
| 三つの仏 (Three Buddhas) | 三つの川 (Three Rivers) |
「三つの川」2 (Three Rivers 2)
「三つの山」のトップとは逆のモデルです。最小価格レベルが3回テストされたときに現れます。パターンの中間高値を価格が上回ると、ボトム反転信号が確認されます。

「スロートップ」1 (Slow Top 1)
小さなボディを持つキャンドルがパターンを形成します。下方向の価格ギャップが「スロートップ」の形成を確認します。
フラットトップの必要な要素およびその確認は下向きに開いた窓(価格ギャップ)です。
フライパンベース (Frying Pan Base) 2
このパターンは下降市場で形成され、価格が底を打ち始めたときに形成されます。その後、上向きの窓が現れます。
価格が底を打ったことを確認するためには上向きの価格ギャップが必要です。
トップ (1) とベース (2) 「タワー」 (Tower)

タワートップ (Tower Top) はトップ反転パターンです。まず、長い白いキャンドル(または白いキャンドルのシリーズ)が現れ、その後市場の上昇が減速し、下落を始めます。「タワー」の頂点は、1つ以上の長い黒いキャンドルが現れた後に形成されたとみなされます。
このモデルの長いキャンドルは高いタワーに似ているため、その名前が付けられています。
「タワー」の底は下降トレンドの低価格エリアで形成されます。1つ以上の長い黒いキャンドルが現れた後、短い休止があります。その後、1つ以上の長い白いキャンドルが現れます。底は、両側にタワー(価格下落を反映する長い黒いキャンドルと価格上昇を示す長い白いキャンドル)で囲まれた底として形成されます。
トレンド継続パターン
ウィンドウ (Window)

ウィンドウ (Window) は、現在および前の取引セッションの極端な値との間の価格ギャップです。
日本のアナリストは、ウィンドウが示す方向に沿って取引すべきだと言います。ウィンドウはサポートとレジスタンスの領域になります。したがって、上昇トレンドのウィンドウはさらなる価格上昇の信号です。調整下落の場合、そのようなウィンドウは価格にサポートを提供するはずです。調整下落の結果としてウィンドウが閉じた場合、前の上昇トレンドは終了したと考えるべきです。日本のアナリストは、ウィンドウが3つの取引セッション以内に閉じない場合、調整下落または上昇前のトレンドが継続する可能性が高いと考えています。特に、低価格レベルに位置する圧縮エリアからの小さな黒いキャンドルから開くウィンドウアップの価格ブレイクアウトは、特に注目すべきであり、遠大な影響を及ぼす可能性があります。
タスキブレイクアップ (Tasuki Break Up) 1 またはダウン (2)

タスキブレイクアップ (Tasuki Break Up) はトレンド継続モデルです。上昇トレンドでは、価格ギャップアップを形成する白いキャンドルの後に黒いキャンドルが現れます。黒いキャンドルの始値は白いキャンドルのボディ内にあり、終値はその下にあります。黒いキャンドルの終値が買いポイントです。ウィンドウが閉じて売り圧力が続く場合、「タスキブレイクアップ」信号はキャンセルされます。パターン内の二つのキャンドルのボディはおおよそ同じサイズであるべきです。
逆は「タスキブレイクダウン」に当てはまります。
両方のモデルは非常にまれです。
価格の高値と安値からのギャッププレイ
1、2回の取引セッション中に急激な価格上昇の後、市場は一時停止します。市場は小さなボディを持つキャンドルのグループを形成し、優柔不断を示すために統合を開始します。その後、始値が価格ギャップを形成します。このモデルは「価格の高値からのギャッププレイ」と呼ばれ、価格が最近の高値付近で変動し、その後価格ギャップアップを形成するためです。

「価格の安値からのギャッププレイ」 は上記パターンの弱気対応物です。

隣接する白いキャンドルの分離 (Separation of Adjacent White Candles)
上昇トレンドで、白いキャンドルがギャップアップを形成して現れ、その後ほぼ同じ始値を持つ約同じサイズの白いキャンドルが続く場合、これは強気継続パターンです。

このパターンは非常にまれです。「隣接する白いキャンドルのブレイクダウン」パターンはさらにまれです。
キャンドルブレイクダウン もトレンド継続モデルです。これが現れると、価格は下落を続けます。低い終値は、価格の下落トレンドが続くことを意味します。
「三つの方法」モデル (Three Methods Model)

このパターンには2つのバリアントがあります:強気の三つの方法パターンと弱気の三つの方法パターン。
強気パターン: (1)
まず、長い白いキャンドルが現れます。その後、小さなボディを持つ下落するキャンドルのグループが続きます(理想的には3つのキャンドルですが、2つまたは4つ以上でも構いません)。主な条件は、これらのキャンドルが白いキャンドルの価格範囲を超えないことです(これは三日間のハラミに似ていますが、ここでは価格範囲に影も含まれます)。小さなキャンドルは任意の色でも構いませんが、通常は黒です。最後に、最初の取引セッションの終値よりも高い終値を持つ長い白いキャンドルが形成されます。このキャンドルの始値も前の取引セッションの終値よりも高い必要があります。
このパターンは西洋の強気フラッグやペナントに似ています。
弱気パターン: (2) 弱気の三つの方法モデルは、強気モデルに似ていますが、下降トレンドで発生します。
三つの方法モデルはトレンド継続モデルです。小さなキャンドルが現れると、市場は一時停止しているように見えます。
「三つの進行する白兵」 (Three Advancing White Soldiers)
このパターンは、一貫して上昇する終値を持つ三つの白いキャンドルのグループを表します。
もし「三つの白兵」が統合期間後の低価格エリアで現れた場合、これは潜在的な強気市場の強さの兆候です。そのようなパターンの各白いキャンドルの始値は前のキャンドルのボディ内にあります(またはそれに近い)。キャンドルの終値は高値に等しいか、それに近いです (図1).

もし2番目と3番目のキャンドル(または3番目のキャンドルのみ)が弱気の兆候を示す場合、反発攻撃パターンが形成されます (図2). このパターンは特に長期の上昇トレンド後に現れると警戒が必要です。市場の弱気の兆候には、キャンドルのボディの減少や最後の二つのキャンドルの比較的長い上ヒゲが含まれます。
2番目のキャンドルが長い白いボディを持ち、新しい高値を記録し、その後小さな白いキャンドルが続く場合、「ブレイキング」パターンが形成されます (図3). 最後の小さなキャンドルは比較的長い白いボディを破る(スターになる)か、前の長いボディの「肩に座る」(前の長いボディの上に座る)ことがあります。このモデルが現れた場合、長期ポジションをクローズすべきです。
反発およびスタールパターンは通常、トップ反転パターンではありませんが、時折、重要な価格下落に続くことがあります。これら二つのモデルは高価格エリアで非常に重要です。
分離モデル (Separation Model)
同じ始値を持つ二つの対照的なキャンドルを含みます。このモデルはトレンドの継続の指標です。
上昇トレンドでは、最初のキャンドルは黒で、その後始値が同じ白いキャンドルが現れます(強気パターン)。下降トレンドでは、最初に白いキャンドルが現れ、その後同じ始値を持つ黒いキャンドルが現れます(弱気パターン)。
ドージ (Doji)
ドージ (Doji) は、始値と終値が同じキャンドルです。
ドージはトレンドの変化の強力な信号です。反転信号として、ドージはトップよりもボトムでの強い確認を必要とします。
長い白いキャンドルの後に現れるドージは、トップでのトレンド変化の非常に強力な信号です。
非常に長い上ヒゲまたは下ヒゲ(またはその両方)を持つドージはロングレッグドージ (Long-Legged Doji)と呼ばれます。このようなドージは、トップで現れる場合に特に重要な役割を果たします。
価格範囲の中央で始値と終値が等しく長い影を持つドージはリックシャドージ (Rickshaw)と呼ばれます。キャンドルがドージではなく、非常に長い上ヒゲまたは下ヒゲと小さなボディを持つ場合、それはハイウェーブ (High Wave)と呼ばれます。高ウェーブのグループはトレンド反転の信号です。
もう一つ非常に重要なドージはトームストーンドージ (Tombstone Doji)です。その始値と終値は日中の安値に等しいです。時々、市場のボトムで現れますが、主な目的はトップの形成を信号することです。
重要なトップまたはボトムで現れる場合、ドージは時折サポートまたはレジスタンスの領域として機能することがあります。
三つのスター (Three Stars)
三つのドージが三つのスター (Three Stars) パターンを形成します。これは非常にまれに現れますが、最も重要な反転パターンです。理想的な「三つのスター」パターンはほとんど存在しませんが、中間のスターがドージで、他の二つがドージまたはそれに近いキャンドルであるモデルも含まれることがあります。

日本人は言います:
「市場参加者の心理、供給と需要の関係、買い手と売り手の相対的な強さ—すべてが単一のキャンドルまたはキャンドルの組み合わせに反映されています。」このセクションはキャンドルスティックチャートの分析への導入に過ぎません。パターン、概念、取引戦略ははるかに多く存在します。しかし、この基本的な導入でも、キャンドルスティックが分析の新しい可能性をどのように開くかのアイデアを与えることができます。」
他の章も読むことができます

初心者向けForexパート10: 数学的分析、インディケーター (Forex trading for beginners Part 10: MATHEMATICAL ANALYSIS, Indicators)
数学的分析、インディケーターの種類、オシレーター、弱気の収束、強気のダイバージェンス、平行性

初心者向けForexパート1: 金融市場 (Forex trading for beginners Part 1: Financial Markets)
はじめに。初心者向けForex取引。金融市場は一見すると抽象的で、異質で、さらには威圧的に見えるかもしれません。それらの中で取引し、働く人々は触れられない専門家や高次の存在のように見えることがよくあります。しかし、神話を超えて見れば、[…]
この記事は次の言語でもご覧いただけます: English Portuguese Español Deutsch Français Русский Українська Indonesian Italiano العربية Chinese 日本語 한국어 Türkçe ไทย Tiếng Việt

