
Links to banks, stocks, exchanges…

Forex trading for beginners Part 10: MATHEMATICAL ANALYSIS, Indicators

Reversal patterns, Stars, Hammer and Hanging, Other reversal patterns, Trend continuation patterns, The main provisions of Japanese technical analysis, Gap play from price highs and lows.
Reversal Patterns
Hammer and Hanging
Man Candlestick:
The body is at the top of the price range. The body color doesn’t matter.
The lower shadow is twice as long as the body.
The candle has no upper shadow or it is very short.
Strengthening Factors:
The longer the lower shadow, the shorter the upper shadow, and the larger the body, the greater the potential.
Although the color of the body does not matter, a bullish-colored hammer indicates more bullish potential, and a bearish-colored hanging man indicates more bearish potential.
Features:
(Color does not matter.)
In the case of a hanging man, confirmation of the bearish signal is important. The greater the downward price gap between the hanging man’s body and the opening price the next period, the greater the likelihood that the hanging man will form a top. Another confirmation of the bearish nature can be a black candle, the closing price of which is lower than the closing price on the day of the appearance of the hanging man.
The previous price dynamics characterize the hammer. Suppose a candle with a clear bearish sign appears in front of the hammer (for example, a long body without shadows). In that case, this is evidence that the bear market is gaining strength, and you need to wait for confirmation that the bulls are in control of the situation (for example, the next candle with a closing price higher than the closing price of the hammer). It is important to monitor whether the hammer has broken through an important support level!
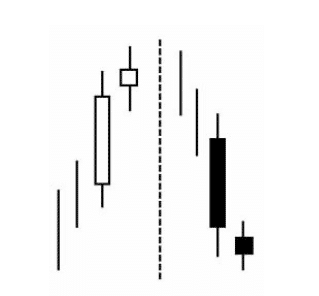
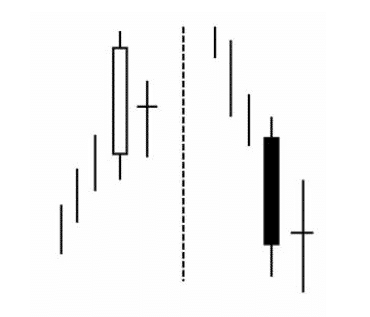
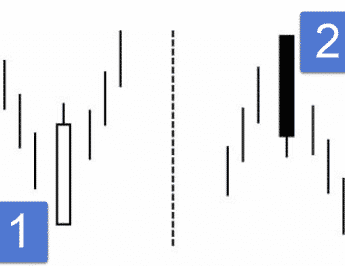
Absorption Model
Description:
There must be a clear trend in the market (even short-term).
Two candles form the pattern. The second body must absorb the first (shadows do not count).
The second body should be a contrasting color. The only exception is when the body is so small that it is comparable to a doji or is a doji (absorption of a tiny white body by a very large white body in a downward trend, absorption of a small black body by a very large black body in an upward trend).
Strengthening Factors:
- · The first candle has a very small body, and the second one is very large.
- · If an engulfing pattern appears after a prolonged or very rapid trend.
- · If the second candle corresponds to a larger trading volume.
- · If the second candle absorbs several bodies.
Clearance in the Clouds
Description: The first candle is black; the second opens well below the low of the previous candle.
The signs are the same as for the Dark Cloud Cover pattern, but while there can be exceptions in the Dark Cloud Cover (the second body does not always cover more than half of the first), the gap has no exceptions! The body of the second candle should cover more than half of the body of the first.
The reason is that there are three models for the continuation of the bearish trend when the second bullish candlestick covers the body of the first one by less than half:
| 1 “Bottom” Pattern (The opening price is slightly higher than the closing price of the black candlestick) | 2 “Bottom” Pattern (The opening price is slightly higher than the closing price of the black candlestick) | 3 “Bottom” Pattern (The opening price is somewhat higher than the closing price of the black candlestick) |
If these patterns and prices form on the chart and then drop below the low of the white candle, it is time to sell.
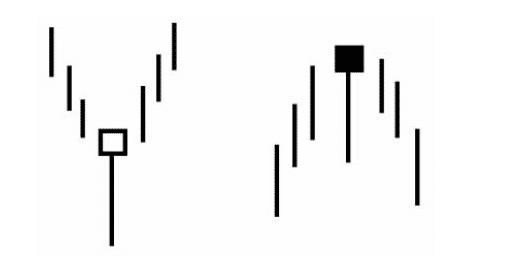
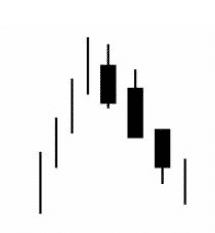
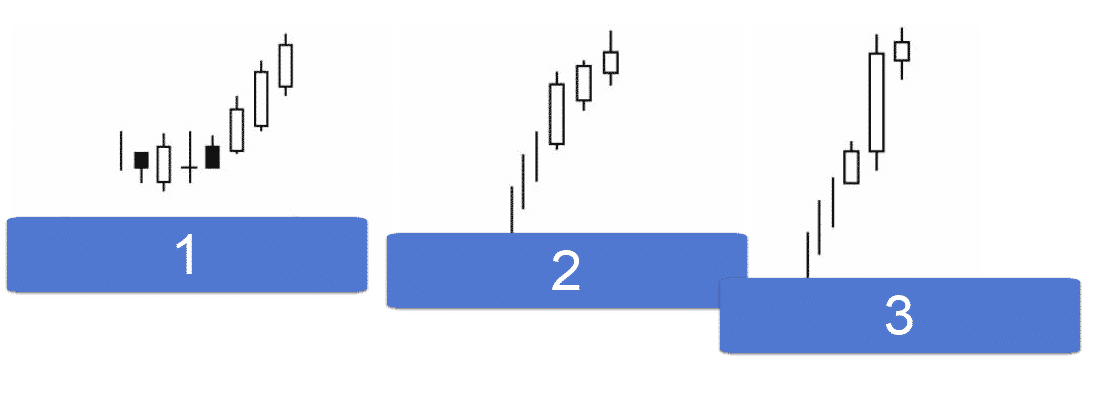
Stars
A star is a candle with a small body (of any color) that forms a price gap with the previous candle with a large body. The gap between the bodies of candles is the main condition for the formation of a star (shadows do not count).
Stars are part of four reversal patterns:
- Evening Star
- Morning Star
- Doji Star
- Falling Star
- Reversal Pattern at the Base
The third candlestick covers a significant part of the body of the first candlestick. Ideally, there is a price gap between the body of the star and both the first and third candles (shadows do not count), but it is not necessary.
Evening Star
The bearish counterpart of the morning star.

The evening star is especially significant at the end of an uptrend but can also occur when it appears at the top of the trading range (resistance level).
Amplifying Factors for Morning and Evening Stars:
- The presence of gaps between the bodies of stars and two neighboring candles.
- The body of the third candlestick covers a significant part of the first candlestick.
- Small trading volume during the first trading session and high volume during the third session.
Evening or Morning Doji Star

The doji star is more important than a regular star because it contains the doji. However, if after the doji, there is a candle (white in an uptrend or black in a downtrend) that forms a price gap (up in an uptrend or down in a downtrend), the doji ceases to be a bearish or bullish signal.
The strongest signal is the “Abandoned Baby”. It is characterized by a price gap of the doji star with neighboring candles, and even the shadows do not intersect.
Falling Star
The body of a Falling Star is small and is at the bottom of the price range of the candle; the upper shadow is long. As with other stars, the body color of a falling star does not matter.
This model warns of a possible end to price growth. Unlike the evening star, it is not among the most important signals. The body of an ideal falling star will form a gap with the body of the previous candle, but it is not necessary.
An Inverted Hammer, similar to a falling star, requires waiting to confirm bullish signals. For example, the next open is above the body of the inverted hammer; another confirmation is a white candle with a higher price level.
Other Reversal Patterns
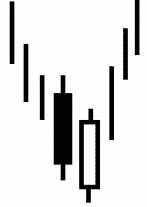
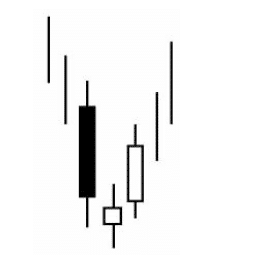
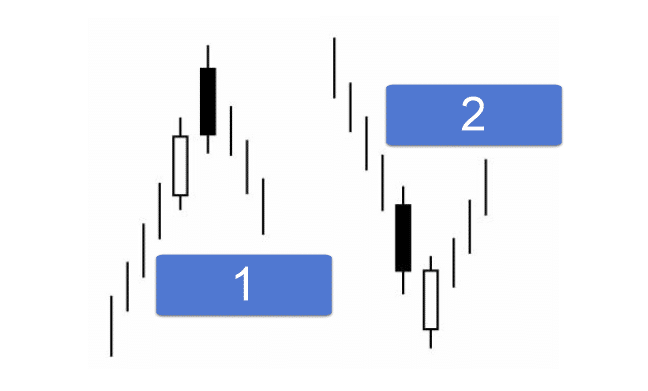
Harami (Pregnant)
A candle with a small body that is within the long body of the previous candle.
The model is the opposite of the Absorption Model. Harami is not a strong signal but only warns of a possible end to a trend. Candles in Harami do not necessarily differ in color, but in most cases, they are contrasting. Shadows don’t matter.
Cross Harami
In the Cross Harami pattern, a doji appears on the second day rather than a candle with a small body. The Cross Harami is one of the most significant reversal signals due to the presence of the powerful doji. Cross Harami patterns can also form at the base, but they are more effective at the top.
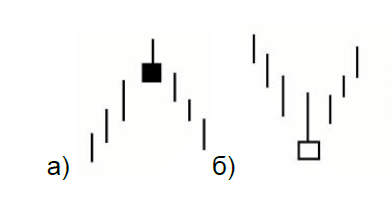
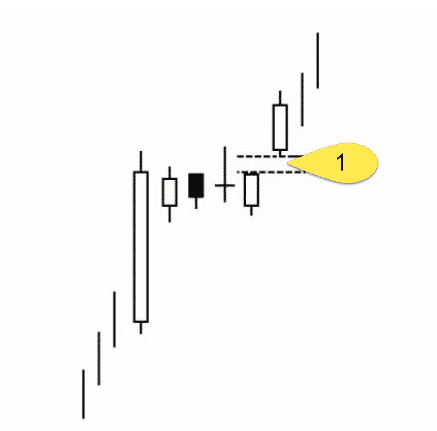
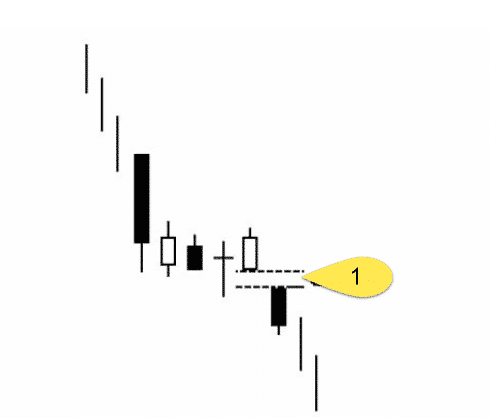
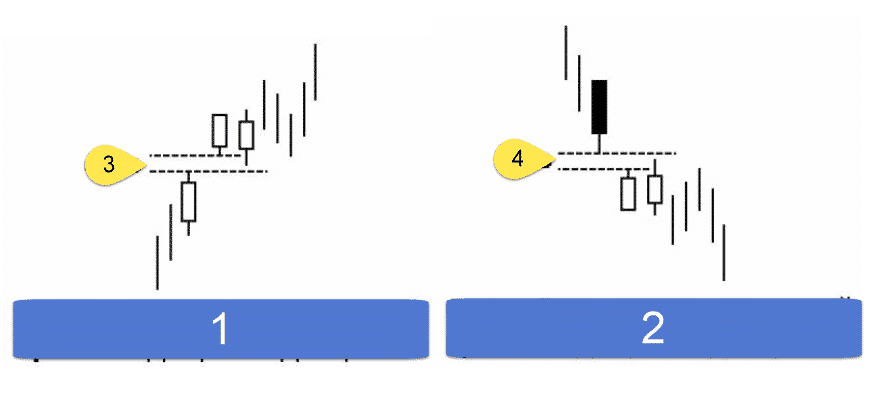
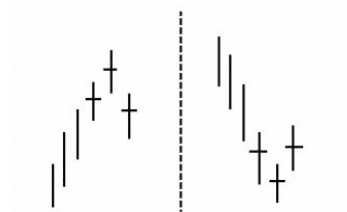
Tops and Bottoms “Tweezers”
The tweezer pattern consists of two or more candlesticks with the same highs (in an uptrend) or lows (in a downtrend). Shadows, bodies, or doji can form tweezers. They are created in consecutive or close trading sessions. Typically, they are not strong reversal signals. Their importance increases if they appear after a long trend or if other candlestick signals confirm their bearish (top) or bullish (bottom) nature.
The following factors can serve as examples of such signals:

| 1 | 2 | 3 |
| Tweezers Peak and Cross Harami | Tweezers Peak and Cross Harami | Tweezers Peak and Cross Harami |
| 4 | 5 | 6 |
| Tweezers Peak and Cross Harami | Tweezers Pinnacle and Hanging Man | Tweezers Peak and Shooting Star |
An additional signal can be a successful test of resistance or support levels by these patterns.
Tweezers tops and bottoms become more significant signals on the weekly and monthly charts. In this case, it is not necessary to wait for confirmation by other candlestick signals.
Hold by the Belt Model
A bullish hold is a long white candle with a lower shadow that appears in a downtrend. A bearish hold is a long black candle with an upper shadow.
The candle has no wicks (lower for a bullish candle and upper for a bearish one), or the wicks are tiny (a few ticks).
The longer the candle, the more important it is for the subsequent development of the market. These candles are also most significant if they have not appeared on the chart for a long time. The signal is canceled by the next closing price that is above a bearish hold or below a bullish hold.
Two Flying Ravens
The term “flying” refers to the price gap between the small body of the first black candle and the body of the previous candle (usually, the last candle has a long white body). “Ravens” consist of two black candles. The pattern is bearish. Ideally, the opening price of the second raven is higher than the opening price of the first raven, and the closing price is lower than the closing price of the first raven. The significance of the model is that if the price fails to rise in the fourth trading session, we should expect prices to fall.
Hold on Tatami
The pattern resembles “Two Flying Ravens” but is a bullish signal.
The first three candles are similar to those in the Two Ravens pattern, but they are followed by another black candle, and then a white candle with an opening price above (gap) the high (upper shadow) of the previous candle or its closing price above the black candle’s high. The “Hold” may include not three but two ravens.
“Two Soaring Ravens” and “Tatami Hold” are quite rare.
Three Black Crows
Description:
Three consecutively falling black candles. They predict a fall in prices if they appear in an area of high prices or after a long upward trend. The closing prices of the three crows must be at or close to the lows. The opening price of each candle must be within the body of the previous candle.
Strengthening Factors:
- The body of the first candle in a row of three crows is below the high of the white candle of the previous trading session.
- The opening price of the second and third crows is the same as the closing price of the first and second crows, respectively.
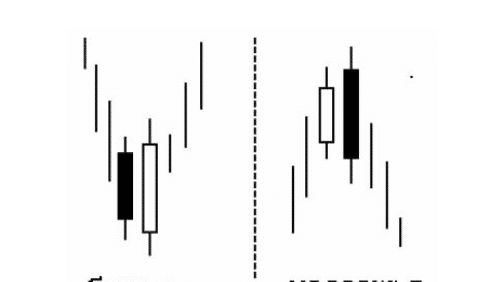
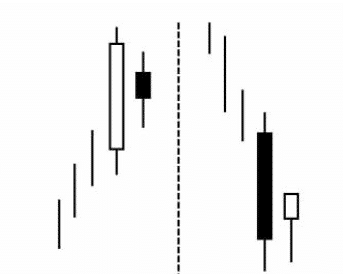
“Counterattack” Model
Two contrasting candles form the Counterattack pattern with the same closing prices. It is similar to the Clearance in the Clouds and Dark Cloud Cover patterns, as it consists of the same combination of candles. However, in the counterattack, the second body does not overlap with the first, making the Clearance and Veil patterns stronger signals.
The bullish counterattack is similar to the bottom pattern, but the white bullish counterattack candle opens much lower (it is much longer), so the counterattack is a reversal pattern, and the bottom is a continuation pattern. The main condition is that the opening price of the second trading session is significantly lower (bullish counterattack) or higher (bearish counterattack) than the previous candle.
Reversal Patterns That Require a Longer Time
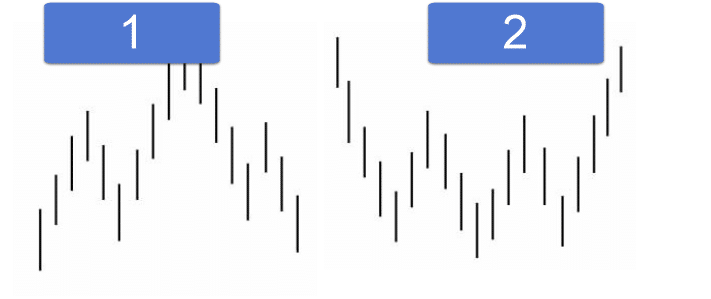
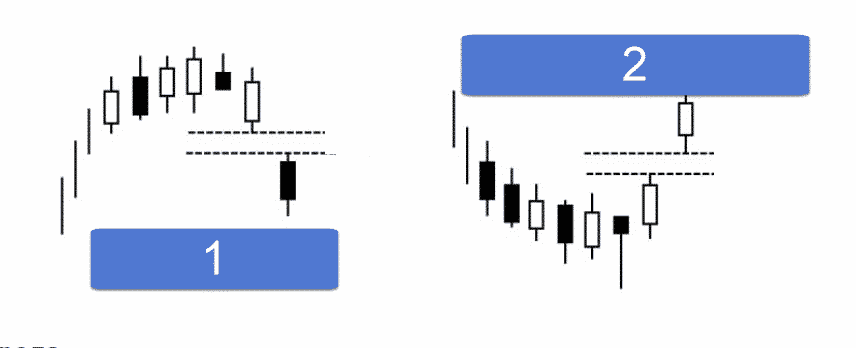
“Three Mountains”
Similar to the Western Triple Top model. An important reversal pattern is at the top. It is formed when the price hits the same high three times or attempts to reach a new high three times. The top of the last mountain should be confirmed in the form of a bearish pattern or candlestick (e.g., doji or dark cloud cover).
“Three Buddhas” 1
Similar to the Western Head and Shoulders pattern.
| 1 | 2 |
| Three Buddhas | Three Rivers |
“Three Rivers” 2
The model is opposite to the top of the “Three Mountains”. It appears when the minimum price level is tested three times. A bottom reversal signal is confirmed when prices rise above the intermediate highs of the pattern.
“Slow Top” 1
Candlesticks with short bodies form the pattern. The downward price gap confirms the formation of a “Slow Top”.
A necessary element of a flat top and its confirmation is a window opened downwards (price gap).
Frying Pan Base 2
The pattern is formed in a declining market when prices start a trough. Then, a window appears upwards.
An upward price gap is required as confirmation that prices have made a bottom.
Top (1) and Base (2) “Tower”
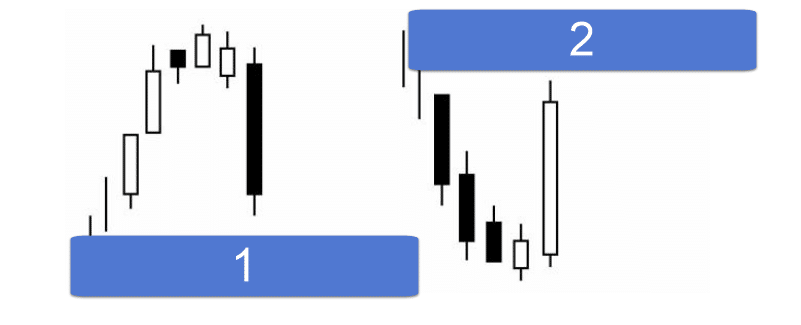
The Tower Top is a top reversal pattern. First, a long white candle (or a series of white candles) appears, then the market advance slows down and begins to decline. The top of the “tower” is considered formed after the appearance of one or more long black candles.
The long candles of this model resemble tall towers, hence its name.
The bottom of the “tower” is formed in the area of low prices in a downtrend. After the appearance of one or more long black candles, there is a short pause. Then, one or more long white candles appear. A bottom is formed, framed on both sides by towers, that is, long black candles reflecting a fall in prices and long white candles showing a rise in prices.
Trend Continuation Patterns
Window
The Window is the price gap between the extreme values of the current and previous trading sessions.
Japanese analysts say that you should trade in the direction indicated by the window. Windows become areas of support and resistance. Thus, a window in an uptrend is a signal of a further rise in price. In corrective downturns, such a window should provide support to prices. If the window closes as a result of a corrective downtrend, the previous uptrend should be considered over. Japanese analysts believe that if the window is not closed within three trading sessions, the trend preceding the corrective decline or rise will continue. Of particular note is a windowed-up price breakout—especially if it opens from a small black candle from a congestion area located at a low price level—which can have far-reaching consequences.
The Main Provisions of Japanese Technical Analysis:
During the correction, prices return to the window.
After three windows are up or three windows are down, a top (if three windows open in an uptrend) or a bottom (if three windows open in a downtrend) is highly likely to occur. This probability increases if any candle or reversal pattern appears after the third window (for example, a doji, a gap in the clouds, or a curtain of dark clouds).
If there is no significant correction after eight or ten new highs or lows, the likelihood of such a correction in the near future is very high.
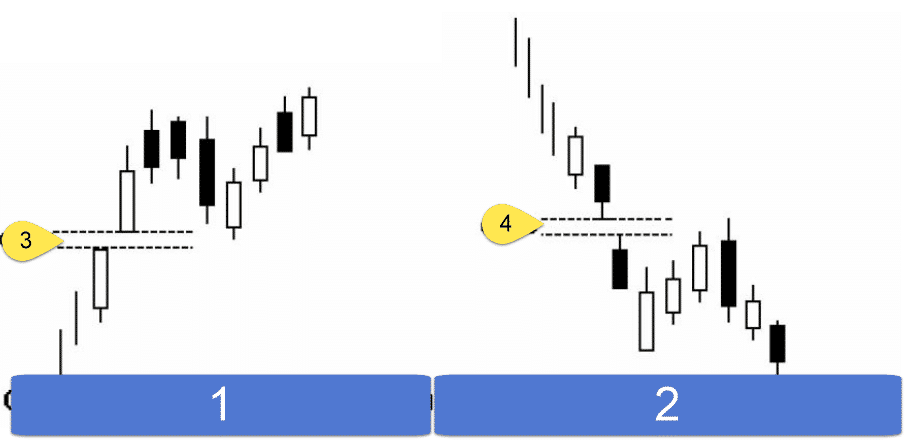
Tasuki Break Up (1) or Down (2)
Tasuki Break Up is a trend continuation model. In an uptrend, after a white candlestick that forms a price gap up, a black candlestick appears. The opening price of the black candlestick is within the body of the white candlestick, and the closing price is below it. The closing price of the black candlestick is the buy point. If the window closes and the selling pressure continues, the “Tasuki Break Up” signal is canceled. The bodies of the two candlesticks in the pattern should be approximately the same size.
The opposite is true for “Tasuki Break Down”.
Both models are very rare.
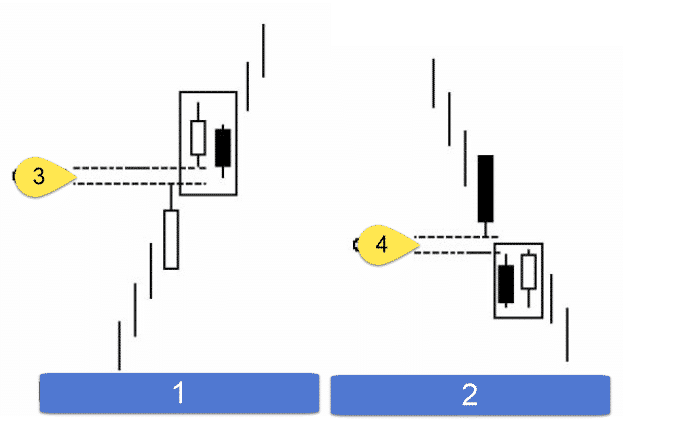
Gap Play from Price Highs and Lows
After a sharp rise in price during one or two trading sessions, the market pauses for a while. The market begins to consolidate, resulting in a group of candles with small bodies, indicating indecision. The opening price then forms a price gap. This model is called “Gap Play from Price Highs” due to the fact that prices fluctuate near a recent high and then form a price gap up.
“Gap Play from Price Lows” is the bearish counterpart to the above pattern.
Separation of Adjacent White Candles
If, in an uptrend, a white candle appears forming a gap up, and then another white candle of about the same size and almost the same opening price follows, then we have a bullish continuation pattern.
The pattern is very rare; even rarer is the pattern of “Adjacent White Candles Breaking Down”.
Candlestick Breakdown is also a trend continuation model. If it appears, prices will continue to fall. A low closing price means that the downward trend in prices will continue.
“Three Methods” Model
There are two variants of this pattern: a bullish three-method pattern and a bearish three-method pattern.
Bullish Pattern: (1)
First, a long white candle appears. Then comes a group of falling candles with small bodies (ideally, there are three such candles, but there may be two or more than three). The main condition is that these candles do not exceed the price range of the white candle (it resembles a three-day harami, but here the price range also includes shadows). Small candles can be of any color but are usually black. At the end, a long white candle is formed with a closing price higher than the closing price of the first trading session. The opening price of this candle should also be higher than the closing price of the previous trading session.
This pattern is reminiscent of bullish flags and pennants in Western technical analysis.
Bearish Pattern: (2) The bearish three-method model is similar to the bullish model but in a downtrend.
The Three Methods model is a trend continuation model. With the appearance of small candles, the market seems to take a pause.
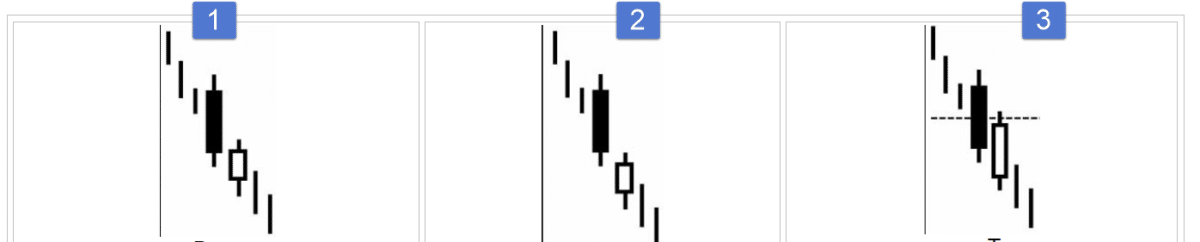
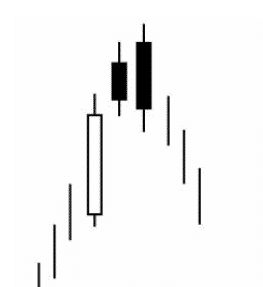
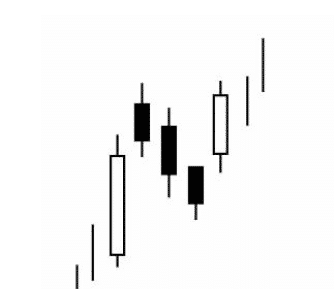
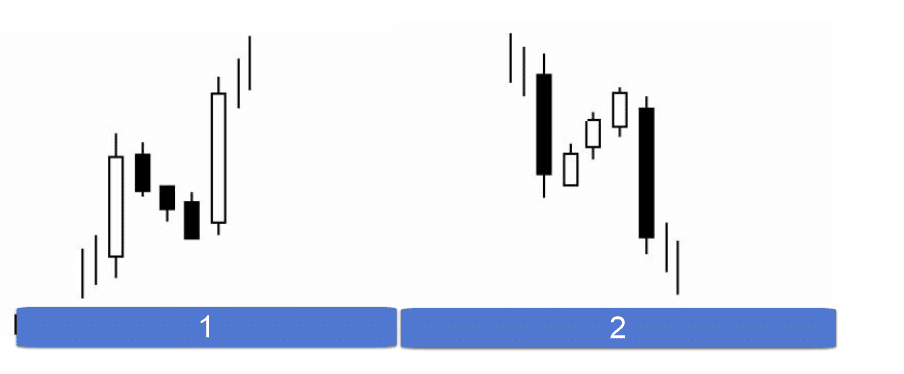
“Three Advancing White Soldiers”
The pattern represents a group of three white candlesticks with consistently rising closing prices.
If the “Three White Soldiers” appear in the area of low prices after a period of consolidation, this is a sign of potential bullish market strength. The opening price of each white candle in such a pattern is within the body of the previous candle (or close to it). The closing prices of the candles are equal to or close to the high prices (Fig. 1).
If the second and third candles (or only the third candle) show signs of weakening, then a repulsed offensive pattern is formed (Fig. 2). This pattern is especially alarming if it appears after a long uptrend. Signs of market weakness can include both decreasing candle bodies and relatively long upper shadows of the last two candles.
If the second candlestick has a long white body and registers a new high, followed by a small white candlestick, then a “Breaking” pattern is formed (Fig. 3). The last small candlestick can either break the relatively long white body (become a star) or “sit on its shoulder” (i.e., sit on top of the previous long body). When this model appears, long positions should be closed.
While rebound and stall patterns are not usually top reversal patterns, they are sometimes followed by significant price declines. These two models are of great importance in the area of high prices.
Separation Model
Includes two contrasting candles with the same opening price. The model is an indicator of the continuation of the trend.
In an uptrend, the first candle is black, and then a white candle appears with the same opening price (bullish pattern). In a downtrend, a white candle appears first, and then a black one with the same opening price as the white candle (bearish pattern).
Doji
A Doji is a candlestick whose opening price is equal to the closing price.
A doji is a strong signal of a change in trend. As a reversal signal, doji requires stronger confirmation at the bottom of the market than at the top.
A very strong signal of a trend change at the top is a doji after a long white candle.
A doji that has a very long upper or lower shadow (or both) is called a Long-Legged Doji. Such a doji plays a particularly important role if it appears at the top.
A doji with long shadows and equal opening and closing prices at the center of the price range is called a Rickshaw. If a candle is not a doji but has a very long upper or lower shadow and a small body, it is called a High Wave. A group of high waves is a trend-reversal signal.
Another very important doji is the Tombstone Doji. Its opening and closing prices are equal to the daily low. Sometimes, it appears at the bottom of the market, but its primary purpose is to signal the formation of a top.
A doji, especially if it occurs at an important top or bottom, can sometimes act as an area of support or resistance.
Three Stars
Three dojis form the Three Stars pattern. It appears very rarely but is the most important reversal pattern. There is almost never an ideal “Three Stars” pattern, but it can also include models where the middle star is a doji, and the other two are either doji or candles close to it.
The Japanese say:
“The psychology of market participants, the relationship of supply and demand, and the relative strength of buyers and sellers—all reflected in a single candlestick or a combination of candlesticks.” This section is only an introduction to the analysis of candlestick charts. There are a much larger number of patterns, concepts, and trading strategies. But even this basic introduction can give you an idea of what new possibilities for analysis candlesticks open up.”
You Can Read Other Chapters

Forex trading for beginners Part 10: MATHEMATICAL ANALYSIS, Indicators
MATHEMATICAL ANALYSIS, Types of indicators, Oscillators ,Bearish convergence, Bullish divergence, Parallelism

Forex trading for beginners Part 1: Financial Markets
INTRODUCTION Forex trading for beginners. At first glance, financial markets may seem abstract, alien, and even intimidating. The people who trade and work within them often appear as untouchable experts or higher beings. However, if you look beyond the myths, […]