
Forex trading for beginners Part 8: Trendlines

Forex trading for beginners Part 6: Consumer demand indicators

Fundamental Data, Market Psychology, and Decision Making
We understand fundamental analysis as the study of events that occur outside the charts of exchange rate quotes but affect these exchange rates.
Generally speaking, everything in the world, even the weather, can influence exchange rates.
In the past, for traders dealing with the Italian lira, meteorological forecasts were useful: if the weather was good, the flow of tourists increased, and consequently, the lira’s exchange rate strengthened!
Why not consider it a fundamental factor of the foreign exchange market? Nowadays, traders can generally ignore European weather patterns, making their work somewhat easier.
To avoid overwhelming information, it is customary to classify fundamental factors into four categories: economic factors, financial policy, political events, and crises.
In this material, we focus on economic factors and certain aspects of financial policy.
These are the main subjects of study in fundamental analysis because there is a direct causal relationship between the economy and the financial markets.
A currency trader should understand this connection and the meaning of key financial and economic indicators. The rest is a matter of technique, more precisely, of technical analysis. For guidance on installing and using automated solutions to merge these analyses, see How to install Expert Advisor and indicators to the MetaTrader terminals.
Charts of economic indicators, like any charts, have trends, support and resistance levels, and mutual correlations.
This means they can be analyzed similarly to exchange rate charts using technical analysis tools.
On the positive side, economic data and key financial indicators for major market economies are widely published at predetermined times.
Based on previous history and forecasts, the market forms an opinion about expected indicator values. From this, market sentiment for each currency emerges—whether to move it up or down.
This opinion can stem from a trader’s own analysis of economic data charts or from comparing and intuitively weighing various experts’ views. For traders interested in leveraging automated analysis and custom strategies, consider the EA The xCustomEA: Universal Trading Advisor for iCustom indicators.
It is best if the trader has their own assessment, checking it against other opinions. However, the main factor when making decisions based on fundamental data is understanding the overall market opinion.
No economic forecast is exact. If published data differ significantly from what the market expected, the market will react accordingly. In such scenarios, sudden and vigorous price movements often begin.
Each economic indicator naturally connects with exchange rate behavior due to its economic content.
One could imagine a simple table of recommendations: if a particular indicator grows, the exchange rate should rise. But whether the market reacts “normally” or does not react—or even moves in the opposite direction—depends on the prevailing market mood, current perceptions, and future expectations.
There is a general cause-and-effect scheme, but specific moods and sentiments can either fit into this scheme (leading to a “normal” market reaction) or contradict it (causing a sharp, non-standard reaction).
We must emphasize the psychological nature of how the market perceives economic data. At the time of publication, the crucial factor is not the indicator’s numerical value alone, but how much it differs from the market’s expectation.
If the released indicator matches the market’s expectation, it is usually already “priced in.” In such cases, there may be no special reaction, even if the indicator is significant (like GDP or inflation).
But if the market expected one thing and completely different figures are published, then the market reaction to significant economic indicators will be noticeable.
Note that the market’s opinion may not coincide with the official forecasts. A professional trader must distinguish one from the other and understand which factors currently matter most to the FOREX market.
The importance of any indicator is not constant. Depending on current economic and financial market conditions, some indicators come to the forefront, and for a time, all eyes remain on them.
Expectations surrounding these indicators may influence currency prices well before the data release.
After publication, the exchange rate can reverse sharply, sometimes moving by whole percentages if the released value differs from the forecast by fractions of a percent.
Later, the market’s focus may shift to other indicators or other currencies. At that point, the once-influential indicator might no longer trigger any significant market response, even if it shows large forecast deviations.
Many examples exist of economic parameters that were once central to market attention but eventually lost their influence as new concerns emerged.
This is natural and inevitable—markets are living organisms, and over time, their priorities and reactions change.
The main goal of this book is to help the trader understand the nature of key economic indicators and to apply this knowledge to trading. To succeed, one must continuously monitor market life, its problems, shifting sentiments, and changing reactions. Remember this!
An economic indicator taken out of context can mislead rather than inform.
For example, a textbook might state that if a particular indicator grows, the exchange rate falls.
A trader seeing this on the screen might hastily sell the currency, only to suffer losses because the exchange rate actually rises.
Why does this happen? Maybe because, prior to the indicator’s release, the market was saturated with comments and polls suggesting everyone expected the indicator to grow, and the price had already adjusted downward in anticipation.
When the data confirm expectations, many traders who sold the currency before now start taking profits by buying at a low price what they sold at a higher price.
Massive buying drives the price up, causing losses for anyone who ignored the market’s prior behavior. Using tools that help analyze and automate reactions can be helpful. For example, the TickSniper Automatic Expert Advisor can assist in quickly reacting to short-term market fluctuations.
Similarly, copying strategies from successful traders or terminals can streamline decision-making. Consider Copylot – Forex copier for trade deals between MetaTrader terminals.
Technical analysis studies market dynamics to identify major price trends, predict future behavior, and determine optimal entry and exit points.
“Market dynamics” includes three main information sources for the technical analyst: price, volume, and time.
Let’s formulate three fundamental principles of technical analysis:
- The price discounts everything. Any factor (economic, political, or psychological) is considered by the market and reflected in the price. The price chart “announces” the market’s intentions, and the analyst’s task is to correctly interpret these signals. There’s no need to know every market participant’s motivation; studying the price chart is sufficient.
- Price movement follows trends. The main goal of charting is to detect these trends early and trade in their direction. A trend is a directional price movement.
- History repeats itself. The principles valid in the past remain valid today and will persist in the future. This underlies all interpolation methods for predicting future price movements, essentially seeing the future as a repetition of the past.
Three types of trends by price movement direction:
- Rising (bullish, uptrend) – prices move up
- Descending (bearish, downtrend) – prices move down
- Sideways (flat, whipsaw) – no definite direction
Three types of trends by duration:
- Long-term (main) – over 6 months to several years
- Medium-term (intermediate) – from 2 weeks to 6 months
- Short-term (minor) – up to 2 weeks
Basic laws of price movement:
- An ongoing trend is more likely to continue than to reverse.
- The trend persists until it shows signs of weakening.
The main tool of classical technical analysis is a chart of price changes over a selected period. Price and volume charts depend on the data plotted.
Before examining chart types used in the FOREX market, note that price data over small intervals can create much “noise,” making long-term assessment difficult.
To filter out short-term fluctuations and market noise, only the main events of the chosen period are used.
At the end of a given time interval, we plot:
- Open – price at the start of the interval
- High – highest price in the interval
- Low – lowest price in the interval
- Close – price at the end of the interval
Thus, continuous information is transformed into discrete data points.
Depending on the time interval selected, charts can be:
- Monthly (M)
- Weekly (W)
- Daily (D)
- Hourly (H)
- Half-hourly
- 15-minute
- 5-minute
Main Types of Charts
Chart types differ by how price data is represented:
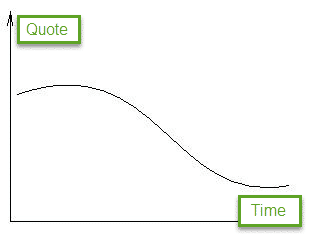
- Linear – A line connecting closing prices. Closing prices are considered the most significant factor. The drawback: it ignores intraperiod price fluctuations.
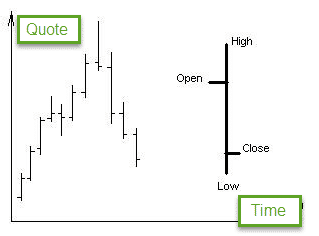
- Bar Chart – Uses four prices: High, Close, Open, Low. The top and bottom of the bar represent the High and Low, respectively. Left and right dashes represent Open and Close.
- Japanese candlesticks – Developed in 17th century Japan, candlestick charts are highly advanced and can serve as an independent technical analysis method.
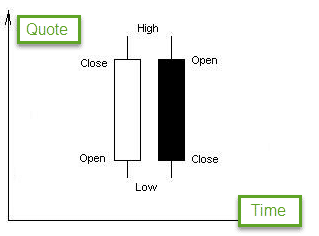
Japanese candlesticks reflect market information and can be analyzed as a standalone method of technical analysis.
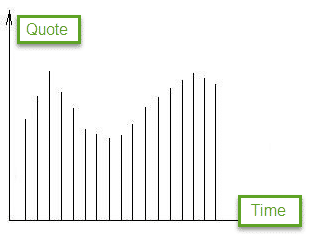
- Volume Charts – Usually placed below the price chart. Tick volume charts show the volume by the number of contracts traded within the selected interval, not by money supply. For analyzing trading performance, consider ExtraReportPad – Trader’s Diary, which provides professional account analysis.
TREND ANALYSIS
A trend is a certain directional price movement. Real markets do not move in straight lines; they zigzag. Identifying trends early and trading in their direction is crucial, aligning with the principle “The trend is your friend.” For automated trend strategies, consider advanced EAs like the AI Sniper Automatic Smart Expert Advisor.
The concept of a trend is essential in the FOREX market. Correctly identifying a trend at an early stage helps preserve and grow your capital. Ignoring it can lead to losses.
Following the trend reduces trading risks. Conversely, going against the trend increases the chance of losses.
The main task of trend analysis is to identify a trend early and determine the most likely short-term price range, as well as the conditions for a price breakout.
Trends in the FOREX market are categorized by duration (long-term, medium-term, short-term) and direction (ascending bullish trend, descending bearish trend, or sideways). For easy trade execution in line with trends, consider the VirtualTradePad (VTP) Trading Panel.
Resistance Lines:
- Connect important highs (tops) of the market.
- When sellers can’t push prices higher, their pressure exceeds buyers’ pressure, causing growth to stop and a decline to begin.
- A key type of resistance line is the resistance level, usually a horizontal line that acts like a “fence” for price movement.
- Prices often bounce off these levels rather than break through. If a resistance level is broken (usually by 20-30 points), it can become a support level.
Support Lines:
- Connect important lows (bottoms) of the market.
- When buyers support the price level, it prevents further declines and can prompt a rise.
- A support level is another type of horizontal “fence.” Prices tend to bounce off support levels rather than break through them. Breaking a support level often turns it into a resistance level.
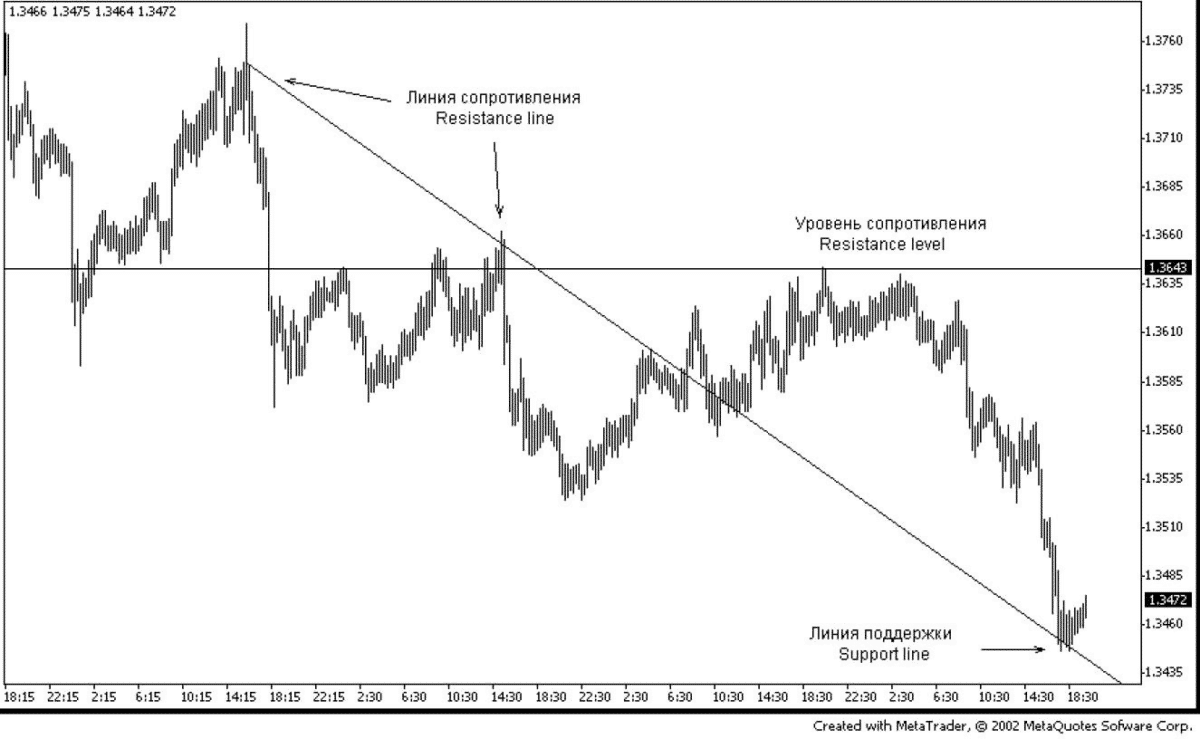
The chart above shows cases where a resistance line breaks and becomes a support line, and vice versa.
Identifying and constructing support/resistance levels is a key part of technical analysis. These levels represent significant psychological price values where many traders change or close their positions.
Knowing potential bounce points allows traders to plan their trades effectively. Level construction is also integral to certain trading tactics. For partial exits and advanced position management, features like Partial Close and Trailing can be useful.
Strength of Levels and Lines of Support and Resistance
The more times prices rebound from a level or line, the more significant it becomes. The longer these levels persist over time, the more traders recognize them, increasing their importance.
For example, a support level lasting three weeks is more significant than one lasting three days, as more traders have interacted with it over time.
Another measure of significance is volume. If heavy trading volume accompanied the formation of a support level, that level is highly significant, and vice versa.
You Can Read Other Chapters

Forex trading for beginners Part 6: Consumer demand indicators
Consumer Demand Indicators reflect consumers’ willingness to spend. High consumer demand can stimulate production and influence the FOREX market. These indicators are critical for understanding economic conditions. For strategies integrating these fundamentals with EAs, see also Working with Telegram in MetaTrader to receive timely market alerts.

Forex trading for beginners Part 8: Trendlines
Learn about building trendlines, selecting TD points, projecting prices, and understanding correction lengths. Mastery of trendlines helps you visualize the market’s direction more clearly. For comprehensive insights into features of various experts, see Functional features of experts from expforex.com.