
Forex trading for beginners Part 9: GRAPHIC PRICE MODELS

Forex trading for beginners Part 7: Market psychology, Types of charts, Trend Analysis

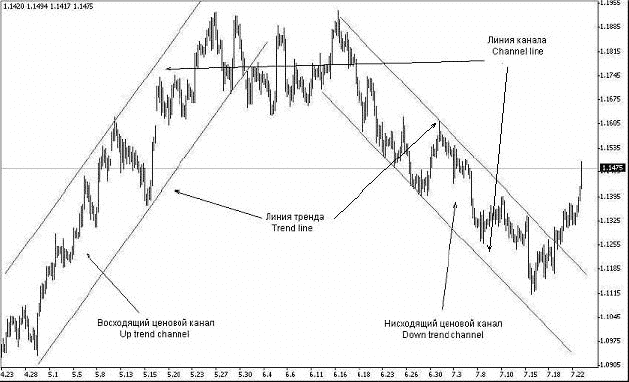
Trend Lines and Channel Lines
Trend lines in trend analysis cannot be overstated because they serve to divide the price space into two zones – the zone where the price remains within the existing trend is most probable.
The zone where the price emerges suggests a change in the current trend.
The trend line acts as a watershed – the price crossing this watershed signals a trend reversal.
In an uptrend, the trend line is drawn as a support line.
In a downtrend, it is marked as a resistance line.
Indeed, until the price crosses the trend line (support line) in an uptrend, it cannot be concluded that this trend has ended and a downtrend or side trend has begun.
Similarly, in a downtrend, only the price crossing the trend line (resistance line) indicates a potential trend change.
Channel lines are lines parallel to the trend line and constructed so that within the existing trend, all prices are enclosed between the trend line and the channel line.
The channel formed by drawing parallel lines (trend line and channel line) represents the optimal trading range.
The direction of the channel – downward, upward, or sideways – determines the market trend.
If prices fluctuate between two parallel straight lines (channel lines), we can discuss the presence of an ascending, descending, or horizontal channel.
When the price is confined within a certain price channel, the trader’s task of making profits is noticeably simplified.
Opening positions in the direction of the trend when the price bounces off the trend line is an ideal market entry.
In contrast, when the price approaches the channel line, closing positions allows you to secure maximum profit, which is the most optimal point for profit-taking.
When the price exits the price channel, it usually moves in the direction of exit by 60-80% of the channel’s width.
Constructing trend lines, support/resistance lines, channel lines, and levels are subjective.
Each person interprets these phenomena in their own way.
With such a personal approach, the number of lines and levels can become excessive, while fewer lines are actually necessary.
In his book “Technical Analysis – The New Science“, Thomas DeMark presents several criteria that reduce the number of lines plotted and bring their number closer to the actual number of trend lines.
Here are some excerpts from his book.
Building Trendlines (Trend Lines)
Like any aspect of charting, drawing a trend line is a form of art.
Sometimes, a line that initially seems accurate needs to be discarded.
However, here are some rules that will help you identify the correct line.
First of all, there should be clear signs of a trend.
This means that to draw an uptrend line, you must have at least two lower lows, with the second low being higher than the first.
Naturally, two points are always required to draw a line.
Once two consecutive declining points, where the next low is higher than the previous one, are marked on the chart, they are connected by a straight line drawn from left to right.
Once the nature of the trend is confirmed, the trend line can be effectively used to address several aspects.
One of the fundamental principles of a trend is that a trend in progress tends to continue its movement.
Therefore, once a trend gains a certain pace and the trend line is at a specific angle, that angle will generally remain consistent as the trend further develops.
In this case, the trend line will help you identify the extreme points of corrective phases and, more importantly, indicate the possibility of a trend reversal.
Let’s say we are dealing with an uptrend.
In this case, the inevitable corrective or intermediate pullbacks will either come close to or touch the rising trend line.
Since a trader expects to buy on dips in an uptrend, the trend line will serve as a support level below the market, which can be used as a buy zone.
Conversely, if the trend is a downtrend, the trend line can be used as a resistance level for selling.
Several parameters characterize the trend line.
The most important characteristic of a trend line is its angle of inclination: it indicates the strength of the trend.
It reflects the market sentiment of the dominant trend.
Another important aspect is the method of drawing a trend line.
Many analysts prefer to construct trend lines through extreme points.
However, Elder believes that such lines are best drawn through areas of dense trading activity, as the goal is to identify the prevailing market sentiment, not the outliers.
Some traders prefer to draw trend lines through closing price points.
However, this approach is not entirely adequate; although the closing price is a significant value, it represents only a specific aspect of price dynamics within the entire period.
Therefore, some analysts argue that the trend line should be constructed by considering both price lows and highs.
Consequently, each trader may choose their own method of constructing a trend line.
Let’s consider one of the methods for choosing two critical points needed to build a trend line.
Building and Selecting TD Points
Market price movements are usually viewed retrospectively – from the past to the future, so the dates on the chart are listed from left to right.
Accordingly, supply and demand lines (trend lines) are built and placed on the chart from left to right.
However, this intuition is flawed.
The movement of prices in the present moment is more important than the market’s movement in the past.
In other words, standard trend lines should be drawn from right to left so that the most recent market data is on the right side of the chart.
Important supply price pivot points are determined when a price high is registered, above which prices have not risen on the day immediately before or after it.
Similarly, important demand price pivot points are determined when a price low is registered, below which prices did not fall immediately before or after it.
Such key points are called TD points.
Trend lines are drawn through TD points.
Any imbalance between supply and demand is reflected on the chart by the appearance of new TD points.
As they appear, TD lines are constantly being adjusted.
Hence, it is important to determine the latest TD points and draw TD lines through them.
There are two methods for improving the selection of TD points.
An important factor in selecting TD points is the closing prices two days before the formation of the pivot price high and the pivot price low.
- When forming a pivot price low, in addition to being the lowest price of the day, it must be higher than the previous pivot price low and lower than the closing price two days before its registration.
- When forming a pivot price high, in addition to being the highest price of the day, it must be lower than the previous pivot price high and higher than the closing price two days before its registration.
Highs and lows recorded without TD point selection improvement methods are called “graphical” highs and lows.
The highs and lows recorded using the TD point selection improvement techniques are referred to as “true” highs and lows.
Assessing the validity of a given point also requires comparing two price values: the last pivot price high (or low) and the closing price on the day immediately following it.
The validity of the pivot price low is questionable if the closing price on the day after its registration is lower than the calculated value of the TD Line’s rate of advance.
Similarly, the validity of the pivot price high is doubtful if the closing price on the day after its registration is higher than the calculated value of the TD Line’s rate of decline.
These corrections significantly reduce the number of TD points and, accordingly, the number of TD lines.
At the same time, they increase the significance of TD points and the reliability of TD lines for determining support and resistance levels and calculating price projections.
Longer TD Lines
The TD lines described earlier have a Level 1 magnitude.
It takes three days to determine each TD point used to build them.
A TD line drawn from two such points is negligible since it may take as little as five days to form two TD points.
However, a trader often needs a longer-term perspective of price developments.
To draw a Level 2 magnitude TD line, each TD point needs at least 5 days to form: the pivot price high must be surrounded on each side by two smaller highs, and the pivot price low by two fewer lows.
Accordingly, to build a TD line with the length of the third level (Level 3 magnitude), it takes at least 7 days to register each TD point, and so on.
In this case, all TD points of a higher extension level are simultaneously TD points of a lower extension level.
However, not all are “active” points of the first level because only the last two are valid first-level TD points.
The TD line of the second and higher extension levels obeys the same laws as the TD lines of the first level.
All levels of TD lines use the same price projectors.
It is preferable to work with first-level TD lines.
Two reasons determine this choice:
- Using higher-order TD lines increases the likelihood that the trend line will be broken before the last TD point is fully formed, causing the trader to miss a profitable opportunity to open a position.
- As the level of the TD line increases, the probability of an opposite signal occurring before the price target is realized proportionally increases.
Breakouts of Trend Lines
Breakouts of trend lines indicate that the dominant group is losing its commanding position.
However, the key here is not to jump to conclusions prematurely.
Now, we approach the question of the criteria for a true breakout of the trend line.
This question is not straightforward, and some degree of subjectivity is unavoidable in answering it.
A breakout of a trend line is only valid when prices close on the other side of the trend line.
Generally, a trend line breakout by the close of the day signifies much more than just an intra-day breakout.
However, sometimes, even a breakout of the day’s closing price is insufficient to indicate a genuine trend line breakout.
Most analysts employ various price and time filters to eliminate false signals.
An example of a price filter is the criterion for breaking the trend line by a certain number of points.
The most common time filter is the so-called two-slot rule.
In other words, a breakout of the trend line is considered true if, for two consecutive intervals (for example, days), the closing prices remain outside of it.
It should be noted that the time and price filters are also used to assess important support and resistance levels, not just the main trend lines.
Very often, a break of a trend line is the first sign of a change in the trend.
One of the methods to determine the minimum price targets when a trend line is broken is the so-called method of finding TD price projections, which is described below.
Price Projections
There are three methods for calculating price projections after a true trend line breakout.
They are called TD price projectors.
Price Projector 1 is the easiest to calculate but has the least accuracy.
It is defined as follows: When a price breakout of a descending TD line occurs, prices usually continue to move higher by at least the distance between the price low below the TD line and the price point on the TD line immediately above it, added to the price at the breakout point.
When a price breakout of an ascending TD line occurs, prices continue to move down to a level calculated as follows: the distance from the high price above the TD line to the price point on the TD line immediately below it is subtracted from the price at the breakout point.
Often, price targets can be determined “by eye”, but most traders require more accuracy.
The rate of change of the TD line can be calculated as follows: the difference between the TD points is divided by the number of days between them (excluding non-trading days).
You can accurately calculate the breakout price by multiplying the additional number of trading days from the last TD point to the breakout point by the rate of change.
By adding to (or subtracting from) the breakout price the difference between the point on the TD line and the price low (high) directly below (above) it, depending on whether it is a buy or a sell, a price target can be determined.
TD Price Projector 2 is somewhat more complicated.
For example, if a descending TD line breaks upward, instead of selecting the minimum price below it, the intraday low below the TD line on the day with the lowest closing price is chosen.
This value is then added to the breakout price.
The smallest intraday low is often recorded on the day with the lowest closing price.
In this case, Price Projector 1 is identical to Price Projector 2.
To calculate the price projector in the event of a downward breakout of an ascending TD line, the key day is considered to be the day with the highest closing price or, more precisely, the intraday high on that day.
It may seem that TD Price Projector 2 is more accurate and conservative than Price Projector 1, but this is not always the case.
For example, suppose the rate of advance or decline is particularly fast, and the closing low in a downtrend or the closing high in an uptrend (key day for Projector 2) occurs earlier than the intraday low or high.
In that case, the price target obtained using Price Projector 2 is larger.
Conversely, if a key day for Projector 2 occurs after an intraday low or high, Price Projector 2 provides a smaller price target.
Projector 3 is even more conservative, calculated as the difference between the TD line and the closing price below it (above it) on the day when the minimum intraday price value (maximum intraday price value) occurs.
Why price projections may not work:
- There was a breakout of an oppositely directed TD line, resulting in a new signal that contradicts the original one. In this case, a new signal, indicating the beginning of a new, opposite trend, becomes effective, replacing the previous one. The calculated price targets are canceled.
- The breakout signal of the TD line was false from the outset. Alternatively, an unexpected event may have sharply upset the balance of supply and demand, causing prices to reverse immediately after the breakout. This becomes apparent the next day when the price of the first trade is recorded. If the current TD line is descending, the price at the open can either fall below this previously broken line and then continue to drop or sharply decline at the open, forming a price gap, and fall below the TD line by the close. In the case of an ascending TD line, the validity of a price breakout is doubtful if the next day, the opening or closing price rises again above the ascending TD line, forming a price gap, and prices continue to grow.
Assessing the Truth of Intraday Price Breakouts
There are three TD Breakout Qualifiers – two price patterns formed the day before the expected breakout and one pattern formed on the day of the breakout.
Suppose the market is oversold (overbought) the day before the breakout.
In that case, it is more likely that buying (selling) pressure will not subside after the breakout, thereby only creating the illusion of potential strength (weakness) in the market.
If the closing price on the eve of the upside breakout is lower than the previous day (an oversold condition), then the probability of a true intraday breakout increases.
In this case, we recommend opening a position when the trend line is crossed intraday.
Conversely, if the closing price on the day before the upward trend line breakout is higher than the previous day, a false breakout is possible.
If the closing price increases the day before the downside breakout, the probability that the intraday breakout is true increases, allowing you to enter the market.
If the closing price has decreased on the eve of the breakout, then a false breakout is possible.
These rules are the essence of the TD Breakout Qualifier 1.
The signal to open a position can be the closing price, indicating an oversold (overbought) market, and the opening price above the descending TD line or below the ascending TD line (TD Breakout Qualifier 2).
Such an opening price suggests extreme strength (weakness) in the market.
It justifies opening a position, even if the closing prices the day before indicated that this is not recommended.
Essence of TD Breakout Qualifier 3: A buy signal is true if the sum of the closing price on the eve of the breakout and the difference between the closing price and the low price on the same day (or the closing price two days before the breakout, if less) is less than the breakout price.
A sell signal is true if the difference between the close on the eve of the breakout and the difference between the high (or the close two days before the breakout, if greater) and the close on the same day is greater than the breakout price.
Correction Lengths
Exchange rates in the Forex market change in a zigzag manner.
Often, prices move against the existing trend.
Such a movement is called a pullback or correction.
In technical analysis, Fibonacci numbers and coefficients are widely used, which, as you know, carry a certain mystical significance.
When calculating the lengths of the correction (the value of the price rollback against the trend), the Fibonacci coefficients of 0.382 and 0.618, as well as the coefficient of 0.5, are used.
In a strong Forex market (where the rate of change of the exchange rate is more than 40 points per minute), the correction length is usually 0.382 of the previous trend’s length.
In an average Forex market (where the rate of change of the exchange rate is within 20-40 points per minute), the correction length is usually equal to 0.5 of the previous trend’s length.
The maximum correction length is 0.618.
This level is the most interesting in terms of entering the market because breaking through this level is no longer considered a correction but a trend reversal.
Thus, the trader opens a position in the direction of the trend and simultaneously sets a stop-loss order 20 points below this correction level.
Below is a chart of the EUR/USD 240-minute rate, on which three correction lengths are pending.
As can be seen from the figure, the price failed to break through the third correction level, and the uptrend continued.
For advanced trading strategies, consider using the xCustomEA, a universal trading advisor for iCustom Indicators.
Enhance your trading efficiency with the VirtualTradePad (VTP) Trading Panel, a trade pad for one-click trading from charts and keyboard.
Utilize the TickSniper Automatic Expert Advisor for precise tick scalping.
Synchronize your trades across multiple terminals with Copylot – Forex Copier for MetaTrader.
Manage your positions effectively using Assistant – the best free trading panel to support positions and deals with real/virtual StopLoss, TakeProfit, and Trailing Stop.
Duplicate your deals and positions seamlessly with the Duplicator – Duplication of Deals/Positions on MetaTrader.
Backtest your strategies with the Tester Pad Forex Trading Simulator.
Automate your trading with the Tick Hamster Automatic Trading Robot.
Learn how to navigate the MetaTrader Market for buying, renting, updating, and installing advisors.
For troubleshooting, refer to MT5 Expert Reports and Server Log Files.
You Can Read Other Chapters

Forex trading for beginners Part 7: Market psychology, Types of charts, Trend Analysis
Fundamental data, market psychology and decision making, Main types of charts, TREND ANALYSIS

Forex trading for beginners Part 9: GRAPHIC PRICE MODELS
GRAPHIC PRICE MODELS, REVERSE MODELS., CONTINUATION PATTERNS, PATTERNS OF CONTINUE REVERSAL,